
Mar 10, 2026
Database Visualization: Statistics and Trends 2026
Database Visualization: Statistics and Trends 2026
Database Visualization: Statistics and Trends 2026
Data is growing faster than ever, making schema visibility critical for modern teams. Explore database visualization trends and statistics for 2026.
Data is growing faster than ever, making schema visibility critical for modern teams. Explore database visualization trends and statistics for 2026.
Data is growing faster than ever, making schema visibility critical for modern teams. Explore database visualization trends and statistics for 2026.

Jonathan Fishner
7 minutes read
TLDR;
TLDR;
Why it matters: Data is growing too fast to manage without clear visibility into the schema.
What’s driving it: Rising data volume + multi-database complexity.
Where it’s headed: More investment in visualization tools through 2026.
How models are changing: Moving beyond tables to graphs, docs, and AI-assisted systems with tools like ChartDB.
Database visualization and data modelling have rapidly shifted from a category of “nice-to-have” to non-negotiable. With the sheer volume of data and the complexity of architectural organizations encountered, it has been necessary to have visual clarity in the data.
At ChartDB, we develop applications to assist teams in visualizing, documenting, and collaborating on database schema diagrams without access to a database. Our platform enables data engineers, analysts, and developers to view relationships.
To get a step ahead, we collected the latest surveys and market research to unpack the most important data visualization trends and statistics for 2026, from AI adoption to graph databases to the tools teams are actually using.
These are a must-read for anyone keeping an eye on DB trends, especially if you work with structured data, relational models, or ER diagrams.
Extensive Use of Data modeling.
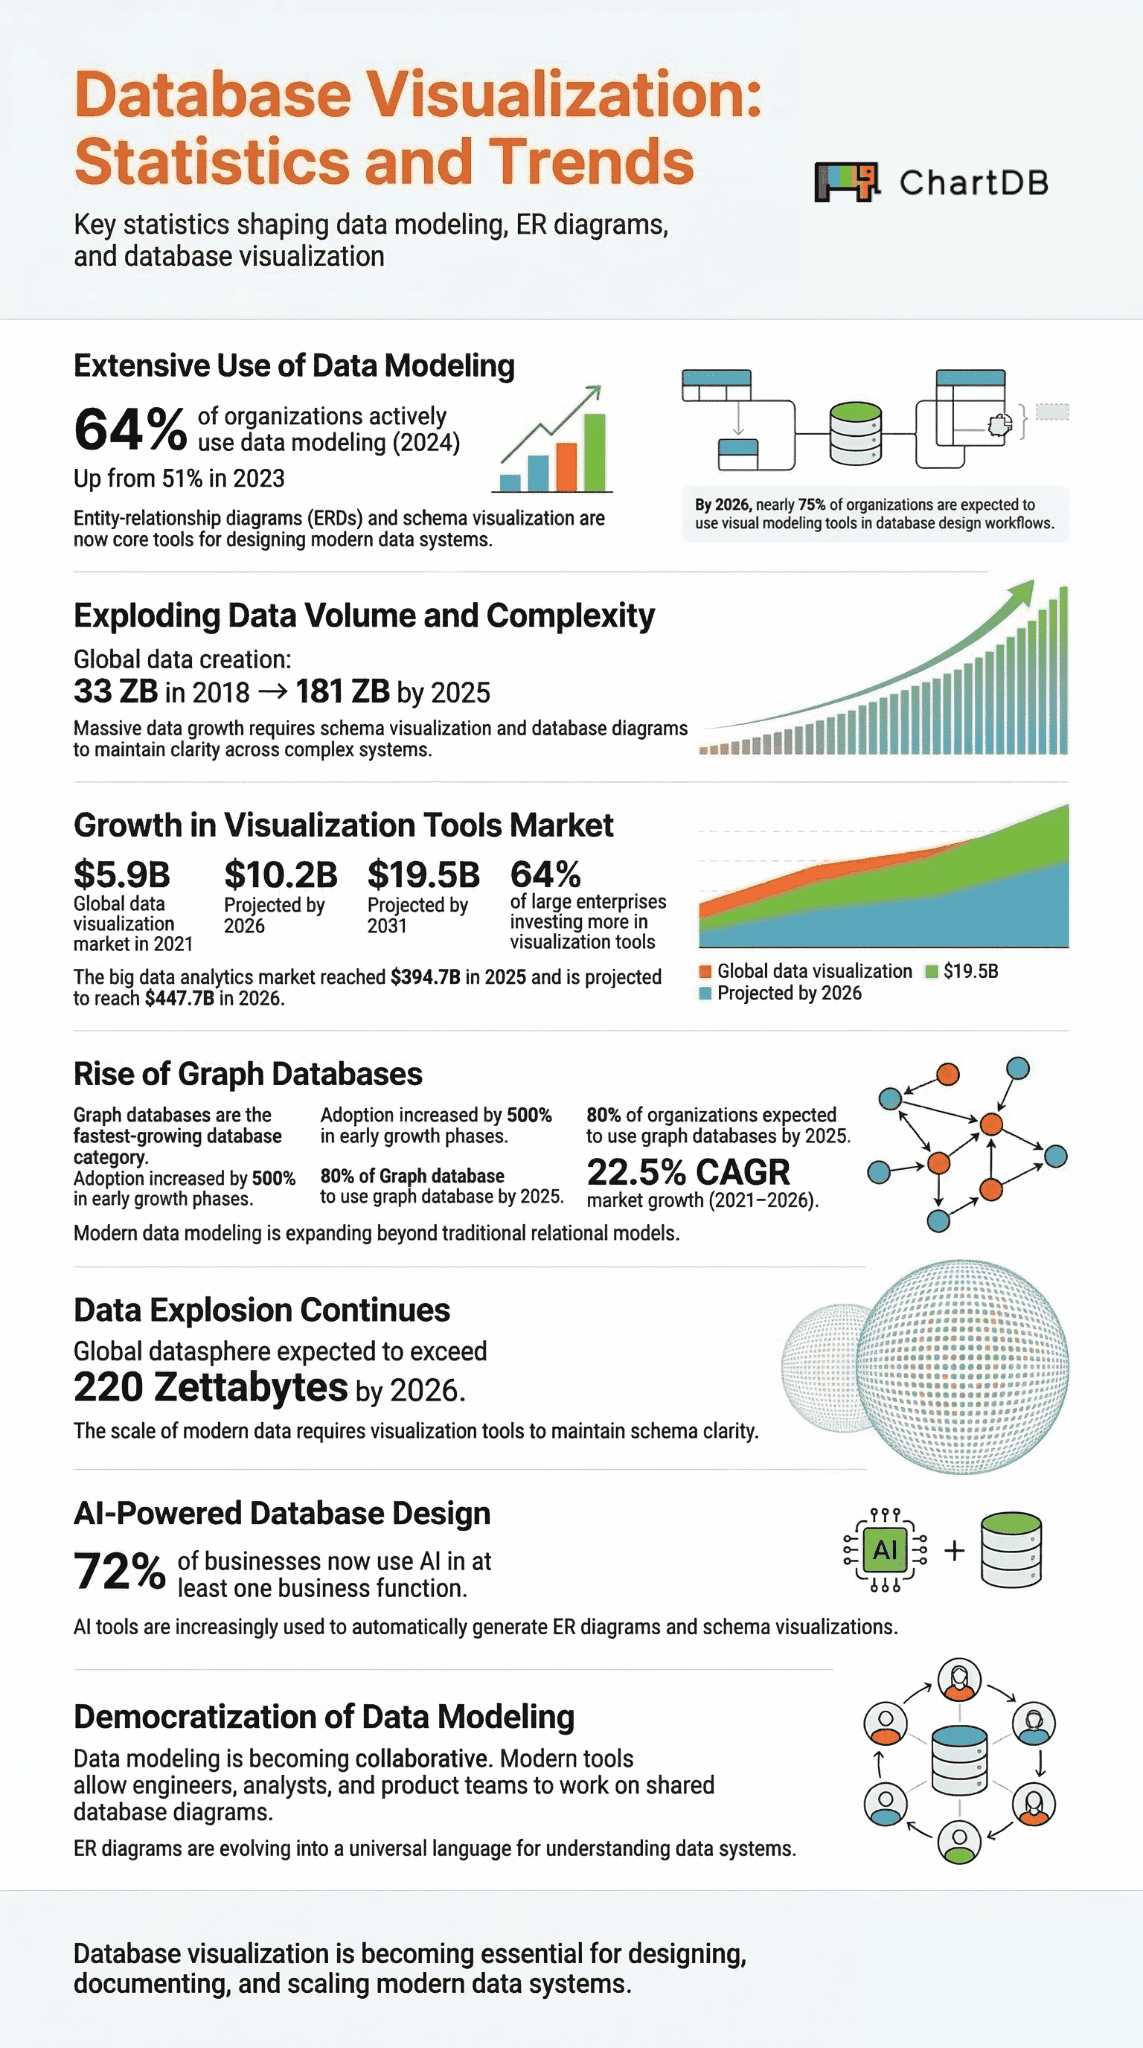
Data modeling has officially become mainstream. The survey by Dataversity in 2024 demonstrated active data modeling use in 64% of organizations which was compared to 51% in 2023. And had a 13% over-year increase.
The global datasphere is expected to grow even further beyond 2025, reaching over 220 zettabytes of data by 2026, highlighting the increasing complexity of managing and visualizing database systems.
Source: Fortune Business Insights
That expansion is an indication of a shared realization that entity-relationship diagrams (ERDs) and schema visualization have become core to the operation of contemporary systems of data. Organizations are also adopting analytics, compliance, and system design through modeling.
It has been estimated that by the year 2026, three-quarters of organizations will have visual modeling and ERD tools in their core workflow to design databases.
Exploding Data Volume and Complexity.
Behind the adoption wave is a purported data creation increase never before seen. Global data creation is expected to reach about 181 zettabytes by 2025, compared to just 33 ZB in 2018, representing more than a five-fold increase in only a few years.
Source: Rivery - Big Data Statistics.
Such volume makes it all different. Without visualization, no human is able to comprehend the big picture. Companies are now dealing with large ecosystems in various databases, clouds, and streams of data. To ensure transparency and data integrity, these complicated environments require up-to-date schema documentation and DB diagrams.
If you work with SQL, check out our guide to generate ER diagrams from SQL.
Growth in Visualization Tools in The Market.
The trend is being followed by the market. The data visualization tools worldwide market is estimated to be about $5.9 billion in 2021 and projected to be about $10.2 billion in 2026, with a CAGR of 11.6%.
Moving now into the future, Allied Market Research estimates that the same market may hit 19.5 billion dollars by the year 2031.
Source: Allied Market Research.The global big data analytics market was valued at $394.7 billion in 2025 and is expected to grow to $447.7 billion in 2026, highlighting the growing demand for tools that help teams understand complex data through visualization.
Source: Fortune Business InsightsWhy the spike? There is a need for teams to get faster insight extraction, communicate findings, and design scalable systems through database structure visualization. The industry survey conducted by Qlik demonstrates that 64 percent of the large-scale enterprises are more concerned with making investments in visualization to enhance the speed of the decision-making process.
Source: Qlik Press Release
Going into 2026, modeling and visualization tools are planned to take even larger budgets by organizations on a data strategy basis.
Recent data visualization trends and market shifts suggest that going into 2026, modeling and visualization tools are planned to take even larger budgets by organizations on a data strategy basis.
Rise of Graph Databases and New Data Models.
Graph databases are transforming data representation and querying. Since 2013, they have been the highest growth category of database, and their adoption is up over 500 percent in only two years during the early 2010s.
It has been popularized by applications such as social networks, fraud detection, and knowledge graphs. Gartner estimates that in 2025, 80 percent of organizations will adopt the use of the graph database in one way or another.
The market of a graph database alone is also expected to expand at a 22.5% CAGR between 2021 and 2026, with a starting value of 1.9 billion.
In 2026, modeling will not be a one-size-fits-all. ER diagrams are growing to incorporate graphs, documents, and hybrid structures.
To make sense of these structures, it helps to first understand the core database relationship types.
AI-Powered Database Design
The use of AI is changing the way data models are developed and supported. Over three-quarters (72 percent) of all businesses today apply AI in some manner of their business operations.
AI is already being incorporated into schema-visualization and ERD. To illustrate, the diagram generator of ChartDB is an AI-powered diagram generator that is able to scan SQL or text data and generate a relational diagram within a few seconds.
And if you're starting from scratch, the free Text to SQL tool lets you describe your data in plain English and get query-ready SQL instantly.
This change saves hours of labor, and human error is minimized. In 2026, AI is expected to be a standard feature in database-modeling systems and assist teams in automatically documenting database schemas, organizing database schemas, and maintaining diagrams up to date with active databases in real time.
Cooperation and Democratization of Data Modeling.
The lone DBA era is over. Visualization of data is turning into a team effort. According to recent research, data democratization is at the top of the list of priorities of business leaders, in connection with the growing involvement of non-technical users in working with structured data.
The modern tools enable several team members: engineers, analysts, and even product managers to work on one diagram. Tools like ChartDB's real-time collaboration feature are built precisely for this, letting distributed teams co-edit schema diagrams without stepping on each other's work. Such features as shared commenting, live editing, and no-code interfaces make it easier for everyone to realize how data can be connected between systems.
By the year 2026, ERDs and schema visualizations will be used as a standard language in companies and not just a development tool.
Outlook for 2026
All signs point in the same direction: database visualization is going to be even more central to how businesses design, manage, and communicate data systems.
The trends in database design tools such as AI automation, real-time collaboration, and multi-model support are converging toward one outcome: visualization becomes the default interface between teams and their data.
Expect:
Most of the organizations shall utilize ERD or schema-visualization software on a regular basis.
Further growth of the market due to modeling being a standard practice in industries.
AI-driven features are built into the visualization packages makes it easier than ever to generate ER diagrams automatically without manual effort.
Cross-functional teamwork where teams share in documentation through diagrams.
The amount of data will continue to increase. Multi-model databases and graphs will elevate to new avenues. More of the technical lift will be taken over by AI, and the interface between humans and data will be a visualization.
Final Thought
These trends are relevant whether you are a data engineer, system architect, or analytics lead. Database visualization is no longer a backend skill but a strategic skill.
Our mission at ChartDB is to make database structure visualization accessible to every team not just the engineers who built the schema, but everyone who depends on understanding it. That's why real-time collaboration is at the heart of what we build. You can Try it For Free to see how visual modeling can transform complicated databases into understandable, easy-to-share maps.
Database visualization and data modelling have rapidly shifted from a category of “nice-to-have” to non-negotiable. With the sheer volume of data and the complexity of architectural organizations encountered, it has been necessary to have visual clarity in the data.
At ChartDB, we develop applications to assist teams in visualizing, documenting, and collaborating on database schema diagrams without access to a database. Our platform enables data engineers, analysts, and developers to view relationships.
To get a step ahead, we collected the latest surveys and market research to unpack the most important data visualization trends and statistics for 2026, from AI adoption to graph databases to the tools teams are actually using.
These are a must-read for anyone keeping an eye on DB trends, especially if you work with structured data, relational models, or ER diagrams.
Extensive Use of Data modeling.
Data modeling has officially become mainstream. The survey by Dataversity in 2024 demonstrated active data modeling use in 64% of organizations which was compared to 51% in 2023. And had a 13% over-year increase.
The global datasphere is expected to grow even further beyond 2025, reaching over 220 zettabytes of data by 2026, highlighting the increasing complexity of managing and visualizing database systems.
Source: Fortune Business Insights
That expansion is an indication of a shared realization that entity-relationship diagrams (ERDs) and schema visualization have become core to the operation of contemporary systems of data. Organizations are also adopting analytics, compliance, and system design through modeling.
It has been estimated that by the year 2026, three-quarters of organizations will have visual modeling and ERD tools in their core workflow to design databases.
Exploding Data Volume and Complexity.
Behind the adoption wave is a purported data creation increase never before seen. Global data creation is expected to reach about 181 zettabytes by 2025, compared to just 33 ZB in 2018, representing more than a five-fold increase in only a few years.
Source: Rivery - Big Data Statistics.
Such volume makes it all different. Without visualization, no human is able to comprehend the big picture. Companies are now dealing with large ecosystems in various databases, clouds, and streams of data. To ensure transparency and data integrity, these complicated environments require up-to-date schema documentation and DB diagrams.
If you work with SQL, check out our guide to generate ER diagrams from SQL.
Growth in Visualization Tools in The Market.
The trend is being followed by the market. The data visualization tools worldwide market is estimated to be about $5.9 billion in 2021 and projected to be about $10.2 billion in 2026, with a CAGR of 11.6%.
Moving now into the future, Allied Market Research estimates that the same market may hit 19.5 billion dollars by the year 2031.
Source: Allied Market Research.The global big data analytics market was valued at $394.7 billion in 2025 and is expected to grow to $447.7 billion in 2026, highlighting the growing demand for tools that help teams understand complex data through visualization.
Source: Fortune Business InsightsWhy the spike? There is a need for teams to get faster insight extraction, communicate findings, and design scalable systems through database structure visualization. The industry survey conducted by Qlik demonstrates that 64 percent of the large-scale enterprises are more concerned with making investments in visualization to enhance the speed of the decision-making process.
Source: Qlik Press Release
Going into 2026, modeling and visualization tools are planned to take even larger budgets by organizations on a data strategy basis.
Recent data visualization trends and market shifts suggest that going into 2026, modeling and visualization tools are planned to take even larger budgets by organizations on a data strategy basis.
Rise of Graph Databases and New Data Models.
Graph databases are transforming data representation and querying. Since 2013, they have been the highest growth category of database, and their adoption is up over 500 percent in only two years during the early 2010s.
It has been popularized by applications such as social networks, fraud detection, and knowledge graphs. Gartner estimates that in 2025, 80 percent of organizations will adopt the use of the graph database in one way or another.
The market of a graph database alone is also expected to expand at a 22.5% CAGR between 2021 and 2026, with a starting value of 1.9 billion.
In 2026, modeling will not be a one-size-fits-all. ER diagrams are growing to incorporate graphs, documents, and hybrid structures.
To make sense of these structures, it helps to first understand the core database relationship types.
AI-Powered Database Design
The use of AI is changing the way data models are developed and supported. Over three-quarters (72 percent) of all businesses today apply AI in some manner of their business operations.
AI is already being incorporated into schema-visualization and ERD. To illustrate, the diagram generator of ChartDB is an AI-powered diagram generator that is able to scan SQL or text data and generate a relational diagram within a few seconds.
And if you're starting from scratch, the free Text to SQL tool lets you describe your data in plain English and get query-ready SQL instantly.
This change saves hours of labor, and human error is minimized. In 2026, AI is expected to be a standard feature in database-modeling systems and assist teams in automatically documenting database schemas, organizing database schemas, and maintaining diagrams up to date with active databases in real time.
Cooperation and Democratization of Data Modeling.
The lone DBA era is over. Visualization of data is turning into a team effort. According to recent research, data democratization is at the top of the list of priorities of business leaders, in connection with the growing involvement of non-technical users in working with structured data.
The modern tools enable several team members: engineers, analysts, and even product managers to work on one diagram. Tools like ChartDB's real-time collaboration feature are built precisely for this, letting distributed teams co-edit schema diagrams without stepping on each other's work. Such features as shared commenting, live editing, and no-code interfaces make it easier for everyone to realize how data can be connected between systems.
By the year 2026, ERDs and schema visualizations will be used as a standard language in companies and not just a development tool.
Outlook for 2026
All signs point in the same direction: database visualization is going to be even more central to how businesses design, manage, and communicate data systems.
The trends in database design tools such as AI automation, real-time collaboration, and multi-model support are converging toward one outcome: visualization becomes the default interface between teams and their data.
Expect:
Most of the organizations shall utilize ERD or schema-visualization software on a regular basis.
Further growth of the market due to modeling being a standard practice in industries.
AI-driven features are built into the visualization packages makes it easier than ever to generate ER diagrams automatically without manual effort.
Cross-functional teamwork where teams share in documentation through diagrams.
The amount of data will continue to increase. Multi-model databases and graphs will elevate to new avenues. More of the technical lift will be taken over by AI, and the interface between humans and data will be a visualization.
Final Thought
These trends are relevant whether you are a data engineer, system architect, or analytics lead. Database visualization is no longer a backend skill but a strategic skill.
Our mission at ChartDB is to make database structure visualization accessible to every team not just the engineers who built the schema, but everyone who depends on understanding it. That's why real-time collaboration is at the heart of what we build. You can Try it For Free to see how visual modeling can transform complicated databases into understandable, easy-to-share maps.

Continue Reading


© 2026 ChartDB
Product
Free Tools
© 2025 ChartDB
Product
Free Tools
© 2025 ChartDB