

Jul 15, 2025
What is an ER Diagram? Usage, Features and More
What is an ER Diagram? Usage, Features and More
What is an ER Diagram? Usage, Features and More
What is an ER diagram? Learn how to understand, use, and create an Entity-Relationship Diagram (ERD) with this beginner-friendly guide by ChartDB.
What is an ER diagram? Learn how to understand, use, and create an Entity-Relationship Diagram (ERD) with this beginner-friendly guide by ChartDB.
What is an ER diagram? Learn how to understand, use, and create an Entity-Relationship Diagram (ERD) with this beginner-friendly guide by ChartDB.

Jonathan Fishner
7 minutes read
TLDR;
TLDR;
• Meaning: An ER diagram is a visual way to map entities, attributes, and relationships, helping you understand how data connects inside a database.
• Why use ERDs: They make schema design clearer, help teams align on structure, and make it easier to spot gaps or issues before writing code.
• Main components & features: ERDs are built using entities, attributes, relationships, and keys that define how data is organised and connected.
• Create your first ERD: List entities, add attributes and keys, connect relationships, and ChartDB helps visualise it quickly.
If you're here, you're probably trying to create your first ER diagram. Or maybe you're redesigning an old database and want to do it properly this time. Either way, you’re in the right place.
I’m Jonathan, the co-founder of ChartDB. After years of designing databases, I realized two things. One, people hate reading schema definitions. Two, they love diagrams when they’re done right. That’s why we built ChartDB: to make data modeling visual, collaborative, and actually fun.
In this blog, you will explore everything from what an ERD diagram is, what it is used for, what features it has, and how you can build your first ERD diagram using ChartDB effortlessly.
Let’s get started.
What is an ER Diagram?
An Entity-Relationship Diagram (ERD) is a visual map of your database. It shows the "things" you store data about, like Users or Products and how those things are connected.
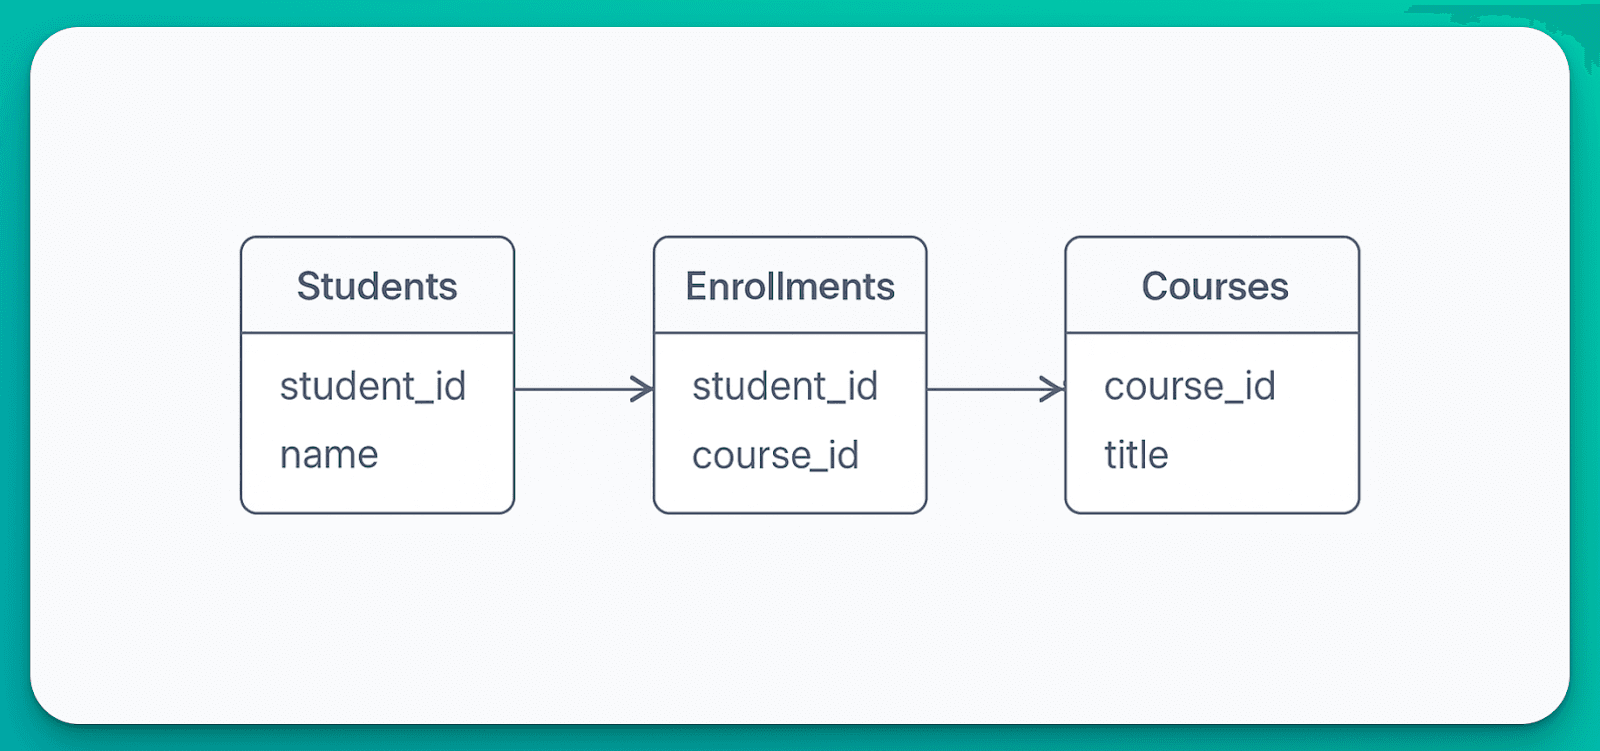
Instead of reading a bunch of SQL, you get a picture. Think of a simple system: Students enroll in Courses. You’d draw a box for Student, one for Course, and a line connecting them. That line represents the relationship. It's a lot easier to reason about how your data fits together when it's laid out visually.
You can create ER diagrams using drag-and-drop visual tools, text-based schema tools, and AI ERD tools that generate diagrams automatically from plain English or SQL.
A Brief History of ERDs
The term "Entity-Relationship Model" was introduced in 1976 by Peter Chen. His paper laid out a way to structure data so humans could reason about it more naturally. Over time, the idea evolved into diagrams and became standard in database education and software design.
Tools like Lucidchart and Gliffy later brought these diagrams into the browser, making them accessible to non-developers and remote teams. They showed that ERDs weren’t just for architects. They were useful for anyone trying to make sense of a system.
Why People Use ERDs
When you’re designing a database, they act as your blueprint. When you’re working with a team, they’re a shared language. And when something breaks, they’re your debugging map.
They help in:
• Planning database structure before development
• Visualising complex systems and relationships
• Aligning engineering, product, and data teams
• Documenting database architecture for onboarding
• Finding missing relationships or design gaps
• Debugging data flow and query issues
• Designing scalable data models
• Communicating structure with non-technical stakeholders
What Makes Up an ERD (Components and Features)
At its core, an ERD (Entity-Relationship Diagram) is made up of a few essential components that help you describe the structure of your database clearly and completely. Let’s break them down in more detail:
Entities are the main objects or concepts that you want to store data about. These usually become tables in your database. There are two types of entities:
Strong Entities: These exist independently and have their unique identifier (primary key). For example, a Customer entity can exist on its own and might have a CustomerID as its primary key.

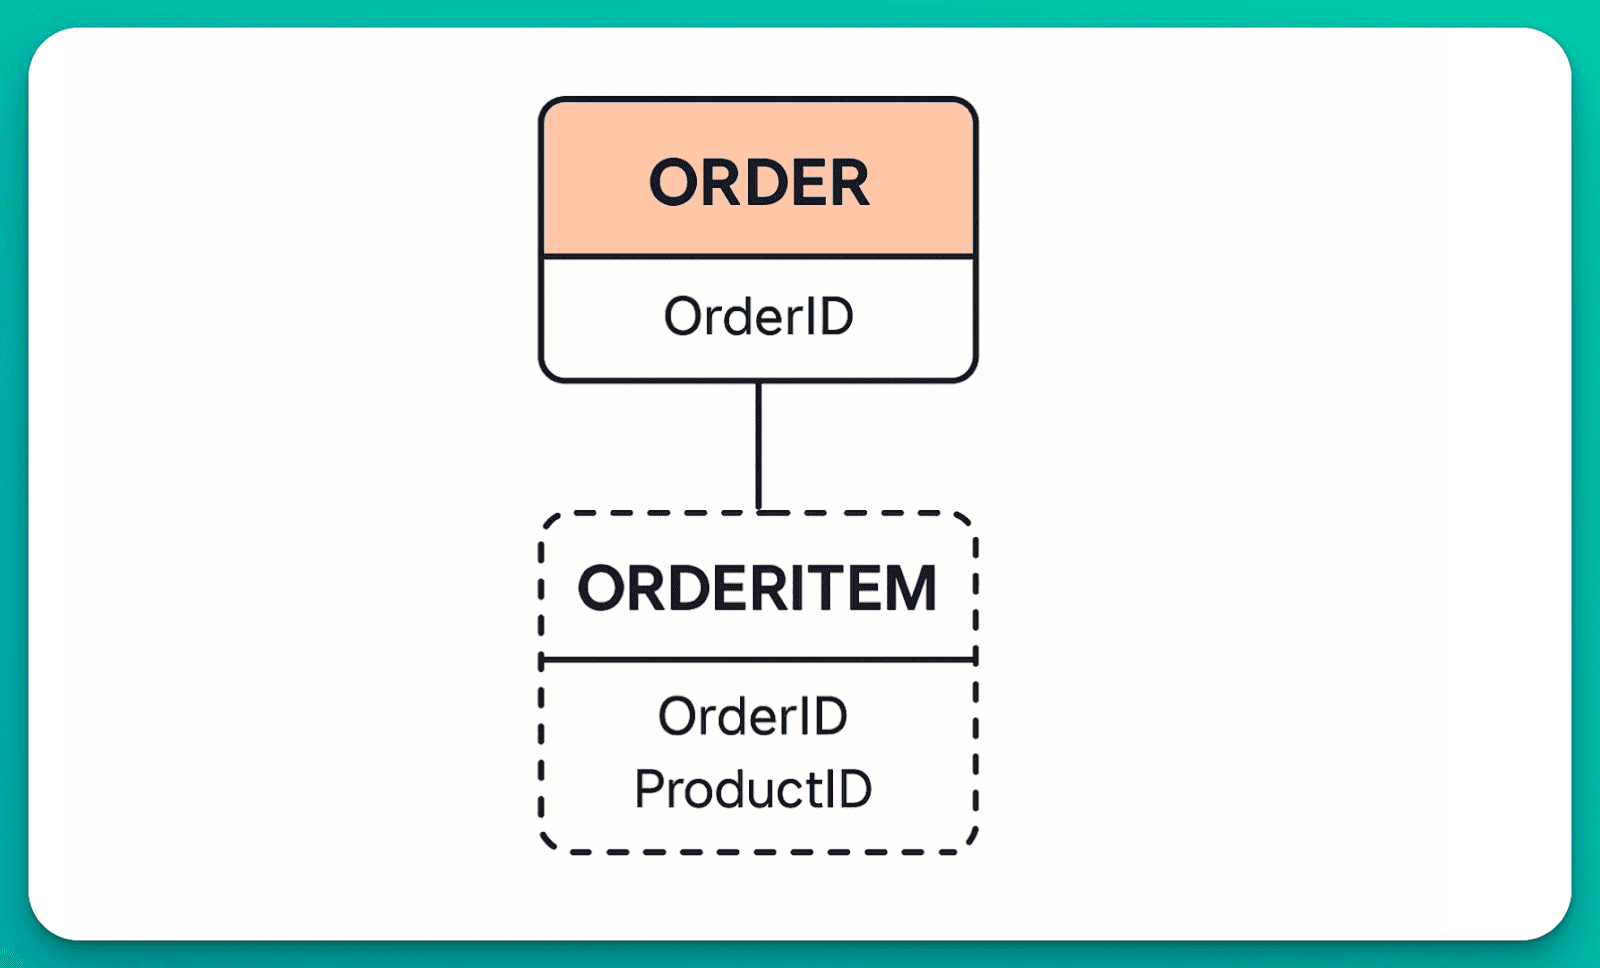
Weak Entities: These depend on another entity for identification. They do not have a sufficient primary key on their own. For example, an OrderItem entity might only make sense when tied to a specific Order, using a combination of OrderID and ProductID to identify each item uniquely.
Attributes
provide details about each entity. In relational databases, they map to the columns in a table. There are different types of attributes:
Simple Attributes: These cannot be broken down further, like FirstName or Email.
Composite Attributes: These can be divided into smaller sub-parts. For example, a FullName attribute might consist of FirstName and LastName.
Derived Attributes: These are not stored directly but are derived from other data. For example, Age can be derived from a DateOfBirth attribute.
Multivalued Attributes: These can hold multiple values. For example, a PhoneNumber attribute might store more than one phone number per user. In a relational schema, these often require a separate table.
Relationships
describe how entities are related to each other.
For example:
- A Customer places many Orders (one-to-many).
- An Order contains multiple Products, and a Product can appear in multiple Orders (many-to-many), which might require a junction entity like OrderItem.
- Relationships may also have attributes (called associative attributes) such as quantity or timestamp, especially in many-to-many relationships. I have covered timestamp fields in more detail in this article.
Keys
help uniquely identify and connect records:
- Super Key: Any combination of attributes that uniquely identifies a record in an entity. For example, {CustomerID, Email} is a super key.
- Candidate Key: A minimal super key. It contains only the necessary attributes to uniquely identify a record. If both CustomerID and Email uniquely identify customers, each is a candidate key.
- Primary Key: The chosen candidate key used to uniquely identify records. It must be unique and not null. For a Customer, this might be CustomerID.
- Foreign Key: An attribute in one entity that refers to the primary key in another. For instance, Order has a CustomerID that links to the Customer entity. To know more, read the guide I have created on the importance of foreign keys.
Understanding these parts is essential. Once you've grasped entities, attributes, relationships, and keys in this way, you're well-equipped to read or design almost any ERD.
How To Build Your First ER-Diagram
Creating your first ERD doesn't need to be intimidating. Start by listing the key things your system tracks like users, orders, or products. Then, think about how these relate. Do users place orders? Can an order contain multiple products? Sketch out entities first, then add attributes and draw relationships.
As you refine it, define which fields uniquely identify each item (your keys) and look for any details that are calculated, repeated, or shared across tables.
5 Quick Tips on ERDs
Don’t skip the primary key. Every entity needs one. Without it, your database won't know how to uniquely identify a row, and that can cause duplicate data or make it impossible to link records across tables.
Use junction tables for many-to-many relationships. Let's say a Product can appear in many Orders, and an Order can contain many Products. You can't just draw a line between the two, you need a middle table, like OrderItem, to manage that relationship. It makes the data easier to query, validate, and extend later (like adding quantity or price).
Break complex attributes into smaller parts. Instead of storing a full name in one column, split it into FirstName and LastName. This makes it easier to sort, filter, and personalize your queries or UI. It also reduces the need for weird string parsing down the line.
If an attribute might contain multiple values, split it into its own entity. Storing multiple phone numbers in a single column gets messy fast. By creating a related PhoneNumber table tied to the User entity, you keep your data clean and extensible, and querying gets way simpler.
Double-check foreign keys point to real primary keys. If a foreign key points to something that doesn't exist, your relationships break. It’s like linking to a broken page. Ensuring that foreign keys reference existing primary keys keeps your data connected and consistent.
How ChartDB Can Help Build an ERD
ChartDB is the tool we built to make ERDs painless. It runs in the browser, supports real-time collaboration, and works with actual databases or from scratch.

Here’s how to build your first ERD:
Sign up at ChartDB.io. Quick login with GitHub or Google.
Click "New Diagram." You can start from a blank canvas or import a schema from your database.
Add Entities. Double-click the canvas or hit the "Add Entity" button. Name it like "User" or "Order."
Add Attributes. Click into each entity to list its fields: ID, Name, Email, etc. Mark the primary key.
Draw Relationships. Drag from one attribute to another to define relationships. ChartDB handles the notation.
Tidy it up. Use auto-layout to make things look nice, or arrange manually.
Export or Share. Save your diagram, download it as an image, or generate SQL to create the tables.
Once you’ve created your ERD using the steps above, you can also keep it live and interactive by embedding live ERD directly into your docs or website, instead of exporting it as a static image. You can even turn the workflow into a visual walkthrough using an AI video creation tool, making it easier to explain complex database structures to both technical and non-technical audiences.
<iframe src="https://app.chartdb.io/diagram/9df7f9d1e30c442c94bd04?clean=true" width="100%" height="180" frameborder="0" scrolling="no" seamless="true"></iframe>

If you want to see the full process of how a SQL script or smart query turns into a complete ERD inside ChartDB, in just a few steps. Watch the video below ⬇️
We recently launched an AI ERD Generator tool, that you can also use to generate diagrams from scratch, finding missing indexes and foreign keys by just using prompt.
Wrap-up
You now know what an ERD diagram is, why it matters, and how to make one without losing your mind.
Recently, I tested many ERD tools, and listed the best ones here. I rated them on different parameters & therefore ranked them.
No more guessing. No more endless SQL scrolling. Just clean, clear diagrams that everyone can understand. If you are someone in need of a visualization tool for a database, you can test ChartDB out, sign up for free from here!
Need my help in setting up an ER diagram for your database? I am a text away on chat!!
FAQ
Q: What is the difference between ERD and a database schema?
A database schema is the technical definition of your database, the tables, columns, data types, and constraints written in SQL. An ERD is a visual representation of that same structure, laid out as a diagram so you can see the big picture at a glance. Think of the schema as the code, and the ERD as the drawing. They complement each other: the schema is for the database engine, the ERD is for the humans.
Q: Can you generate an ER diagram from an existing database?
Yes, and you don't need to rebuild anything from scratch. With ChartDB, you can connect your existing database (PostgreSQL, MySQL, SQL Server, SQLite, and more), and it will automatically pull in all your tables, columns, relationships, and keys into a visual diagram. From there you can use auto-layout to clean things up, explore relationships, and even use our AI ERD Generator to spot missing foreign keys or indexes you might have overlooked.
Additional Resources
Here are some more resources that you may find useful in your journey to create ERDs.
If you're here, you're probably trying to create your first ER diagram. Or maybe you're redesigning an old database and want to do it properly this time. Either way, you’re in the right place.
I’m Jonathan, the co-founder of ChartDB. After years of designing databases, I realized two things. One, people hate reading schema definitions. Two, they love diagrams when they’re done right. That’s why we built ChartDB: to make data modeling visual, collaborative, and actually fun.
In this blog, you will explore everything from what an ERD diagram is, what it is used for, what features it has, and how you can build your first ERD diagram using ChartDB effortlessly.
Let’s get started.
What is an ER Diagram?
An Entity-Relationship Diagram (ERD) is a visual map of your database. It shows the "things" you store data about, like Users or Products and how those things are connected.
Instead of reading a bunch of SQL, you get a picture. Think of a simple system: Students enroll in Courses. You’d draw a box for Student, one for Course, and a line connecting them. That line represents the relationship. It's a lot easier to reason about how your data fits together when it's laid out visually.
You can create ER diagrams using drag-and-drop visual tools, text-based schema tools, and AI ERD tools that generate diagrams automatically from plain English or SQL.
A Brief History of ERDs
The term "Entity-Relationship Model" was introduced in 1976 by Peter Chen. His paper laid out a way to structure data so humans could reason about it more naturally. Over time, the idea evolved into diagrams and became standard in database education and software design.
Tools like Lucidchart and Gliffy later brought these diagrams into the browser, making them accessible to non-developers and remote teams. They showed that ERDs weren’t just for architects. They were useful for anyone trying to make sense of a system.
Why People Use ERDs
When you’re designing a database, they act as your blueprint. When you’re working with a team, they’re a shared language. And when something breaks, they’re your debugging map.
They help in:
• Planning database structure before development
• Visualising complex systems and relationships
• Aligning engineering, product, and data teams
• Documenting database architecture for onboarding
• Finding missing relationships or design gaps
• Debugging data flow and query issues
• Designing scalable data models
• Communicating structure with non-technical stakeholders
What Makes Up an ERD (Components and Features)
At its core, an ERD (Entity-Relationship Diagram) is made up of a few essential components that help you describe the structure of your database clearly and completely. Let’s break them down in more detail:
Entities are the main objects or concepts that you want to store data about. These usually become tables in your database. There are two types of entities:
Strong Entities: These exist independently and have their unique identifier (primary key). For example, a Customer entity can exist on its own and might have a CustomerID as its primary key.
Weak Entities: These depend on another entity for identification. They do not have a sufficient primary key on their own. For example, an OrderItem entity might only make sense when tied to a specific Order, using a combination of OrderID and ProductID to identify each item uniquely.
Attributes
provide details about each entity. In relational databases, they map to the columns in a table. There are different types of attributes:
Simple Attributes: These cannot be broken down further, like FirstName or Email.
Composite Attributes: These can be divided into smaller sub-parts. For example, a FullName attribute might consist of FirstName and LastName.
Derived Attributes: These are not stored directly but are derived from other data. For example, Age can be derived from a DateOfBirth attribute.
Multivalued Attributes: These can hold multiple values. For example, a PhoneNumber attribute might store more than one phone number per user. In a relational schema, these often require a separate table.
Relationships
describe how entities are related to each other.
For example:
- A Customer places many Orders (one-to-many).
- An Order contains multiple Products, and a Product can appear in multiple Orders (many-to-many), which might require a junction entity like OrderItem.
- Relationships may also have attributes (called associative attributes) such as quantity or timestamp, especially in many-to-many relationships. I have covered timestamp fields in more detail in this article.
Keys
help uniquely identify and connect records:
- Super Key: Any combination of attributes that uniquely identifies a record in an entity. For example, {CustomerID, Email} is a super key.
- Candidate Key: A minimal super key. It contains only the necessary attributes to uniquely identify a record. If both CustomerID and Email uniquely identify customers, each is a candidate key.
- Primary Key: The chosen candidate key used to uniquely identify records. It must be unique and not null. For a Customer, this might be CustomerID.
- Foreign Key: An attribute in one entity that refers to the primary key in another. For instance, Order has a CustomerID that links to the Customer entity. To know more, read the guide I have created on the importance of foreign keys.
Understanding these parts is essential. Once you've grasped entities, attributes, relationships, and keys in this way, you're well-equipped to read or design almost any ERD.
How To Build Your First ER-Diagram
Creating your first ERD doesn't need to be intimidating. Start by listing the key things your system tracks like users, orders, or products. Then, think about how these relate. Do users place orders? Can an order contain multiple products? Sketch out entities first, then add attributes and draw relationships.
As you refine it, define which fields uniquely identify each item (your keys) and look for any details that are calculated, repeated, or shared across tables.
5 Quick Tips on ERDs
Don’t skip the primary key. Every entity needs one. Without it, your database won't know how to uniquely identify a row, and that can cause duplicate data or make it impossible to link records across tables.
Use junction tables for many-to-many relationships. Let's say a Product can appear in many Orders, and an Order can contain many Products. You can't just draw a line between the two, you need a middle table, like OrderItem, to manage that relationship. It makes the data easier to query, validate, and extend later (like adding quantity or price).
Break complex attributes into smaller parts. Instead of storing a full name in one column, split it into FirstName and LastName. This makes it easier to sort, filter, and personalize your queries or UI. It also reduces the need for weird string parsing down the line.
If an attribute might contain multiple values, split it into its own entity. Storing multiple phone numbers in a single column gets messy fast. By creating a related PhoneNumber table tied to the User entity, you keep your data clean and extensible, and querying gets way simpler.
Double-check foreign keys point to real primary keys. If a foreign key points to something that doesn't exist, your relationships break. It’s like linking to a broken page. Ensuring that foreign keys reference existing primary keys keeps your data connected and consistent.
How ChartDB Can Help Build an ERD
ChartDB is the tool we built to make ERDs painless. It runs in the browser, supports real-time collaboration, and works with actual databases or from scratch.
Here’s how to build your first ERD:
Sign up at ChartDB.io. Quick login with GitHub or Google.
Click "New Diagram." You can start from a blank canvas or import a schema from your database.
Add Entities. Double-click the canvas or hit the "Add Entity" button. Name it like "User" or "Order."
Add Attributes. Click into each entity to list its fields: ID, Name, Email, etc. Mark the primary key.
Draw Relationships. Drag from one attribute to another to define relationships. ChartDB handles the notation.
Tidy it up. Use auto-layout to make things look nice, or arrange manually.
Export or Share. Save your diagram, download it as an image, or generate SQL to create the tables.
Once you’ve created your ERD using the steps above, you can also keep it live and interactive by embedding live ERD directly into your docs or website, instead of exporting it as a static image. You can even turn the workflow into a visual walkthrough using an AI video creation tool, making it easier to explain complex database structures to both technical and non-technical audiences.
<iframe src="https://app.chartdb.io/diagram/9df7f9d1e30c442c94bd04?clean=true" width="100%" height="180" frameborder="0" scrolling="no" seamless="true"></iframe>
If you want to see the full process of how a SQL script or smart query turns into a complete ERD inside ChartDB, in just a few steps. Watch the video below ⬇️
We recently launched an AI ERD Generator tool, that you can also use to generate diagrams from scratch, finding missing indexes and foreign keys by just using prompt.
Wrap-up
You now know what an ERD diagram is, why it matters, and how to make one without losing your mind.
Recently, I tested many ERD tools, and listed the best ones here. I rated them on different parameters & therefore ranked them.
No more guessing. No more endless SQL scrolling. Just clean, clear diagrams that everyone can understand. If you are someone in need of a visualization tool for a database, you can test ChartDB out, sign up for free from here!
Need my help in setting up an ER diagram for your database? I am a text away on chat!!
FAQ
Q: What is the difference between ERD and a database schema?
A database schema is the technical definition of your database, the tables, columns, data types, and constraints written in SQL. An ERD is a visual representation of that same structure, laid out as a diagram so you can see the big picture at a glance. Think of the schema as the code, and the ERD as the drawing. They complement each other: the schema is for the database engine, the ERD is for the humans.
Q: Can you generate an ER diagram from an existing database?
Yes, and you don't need to rebuild anything from scratch. With ChartDB, you can connect your existing database (PostgreSQL, MySQL, SQL Server, SQLite, and more), and it will automatically pull in all your tables, columns, relationships, and keys into a visual diagram. From there you can use auto-layout to clean things up, explore relationships, and even use our AI ERD Generator to spot missing foreign keys or indexes you might have overlooked.
Additional Resources
Here are some more resources that you may find useful in your journey to create ERDs.

Continue Reading


© 2026 ChartDB
Product
Free Tools
© 2025 ChartDB
Product
Free Tools
© 2025 ChartDB