

Mar 2, 2026
How to Generate an ERD from SQL using ChartDB
How to Generate an ERD from SQL using ChartDB
How to Generate an ERD from SQL using ChartDB
In this tutorial, we will understand how you can generate an Entity-Relationship Diagram using ChartDB in a step-by-step manner.
In this tutorial, we will understand how you can generate an Entity-Relationship Diagram using ChartDB in a step-by-step manner.
In this tutorial, we will understand how you can generate an Entity-Relationship Diagram using ChartDB in a step-by-step manner.

Jonathan Fishner
10 minutes read
TLDR;
TLDR;
• What this guide covers: Learn how to turn a raw SQL schema into a clear ER diagram using ChartDB, especially helpful for legacy databases with little or no documentation.
• Setup before starting: You’ll need a SQL file (or access to your database), a text editor or SQL client, and a ChartDB account to import and visualise your schema.
* Step-by-step workflow: Import your SQL, generate the diagram automatically, add missing relationships using AI suggestions, organise tables into logical areas, and annotate for clarity.
* Export and reuse your ERD: Once your diagram is ready, you can save, export, or embed it so the schema stays easy to reference across projects and teams.
Ever inherited a database with zero documentation?
You open up a SQL file from a former developer working on the project that you are assigned to now, and you see a ton of table definitions, unfamiliar column names, and no clue how the pieces connect.
Well, if this is something that if it sounds familiar, you’re not alone.
Now there’s a quick way to turn a legacy SQL schema into a clear visual map that you can share with your team & this guide will tell you how to do that right.
Just before getting into the real deal, a little about me ⬇️
I'm Jonathan, founder of ChartDB (An SQL Database Visualizer). After years of working with databases across all kinds of systems and industries, I've seen the same challenge pop up again and again: trying to make sense of a tangled schema with no foreign keys and zero documentation. So I, with my partner, built ChartDB to fix that.
In this post, I’ll walk you through the simplest way to generate an ERD from a SQL file using ChartDB. Whether you're trying to onboard faster, plan a migration, or just get a mental model of how things fit together, this process will save you hours of frustration.
What You Need To Start Building an ERD from SQL
Here’s a short checklist to make sure you’re ready:
A SQL schema file
Usually a .sql file withCREATE TABLEstatements and, if you’re lucky, some foreign keys.A text editor / SQL Client
VS Code, Notepad++, or anything you like. This helps with quick edits or checking what’s inside the file. Or Postico, DBeaver, Beekeeper Studio, SSMS, Azure Data Studio or anything you like.Access to chartdb.io
Head over to chartdb.io, sign up for free, and you’re ready to go. No installation needed.
6 Quick Steps To Generate an ERD
You can generate ERDs using different ERD tools. The walkthrough below shows how you can create one easily and effortlessly using ChartDB.
Check out this quick video walkthrough👇
Read further, if you prefer understanding via text.
Step 1: Take a Quick Look at Your SQL File
Open your SQL file in a text editor and check if it includes the CREATE TABLE statements. If you're dealing with a legacy system, chances are there won’t be many foreign keys, and that’s okay. You can still visualize the structure and add relationships manually later. While reviewing queries, you can use the SQL LIKE Pattern Tester to quickly understand wildcard patterns.
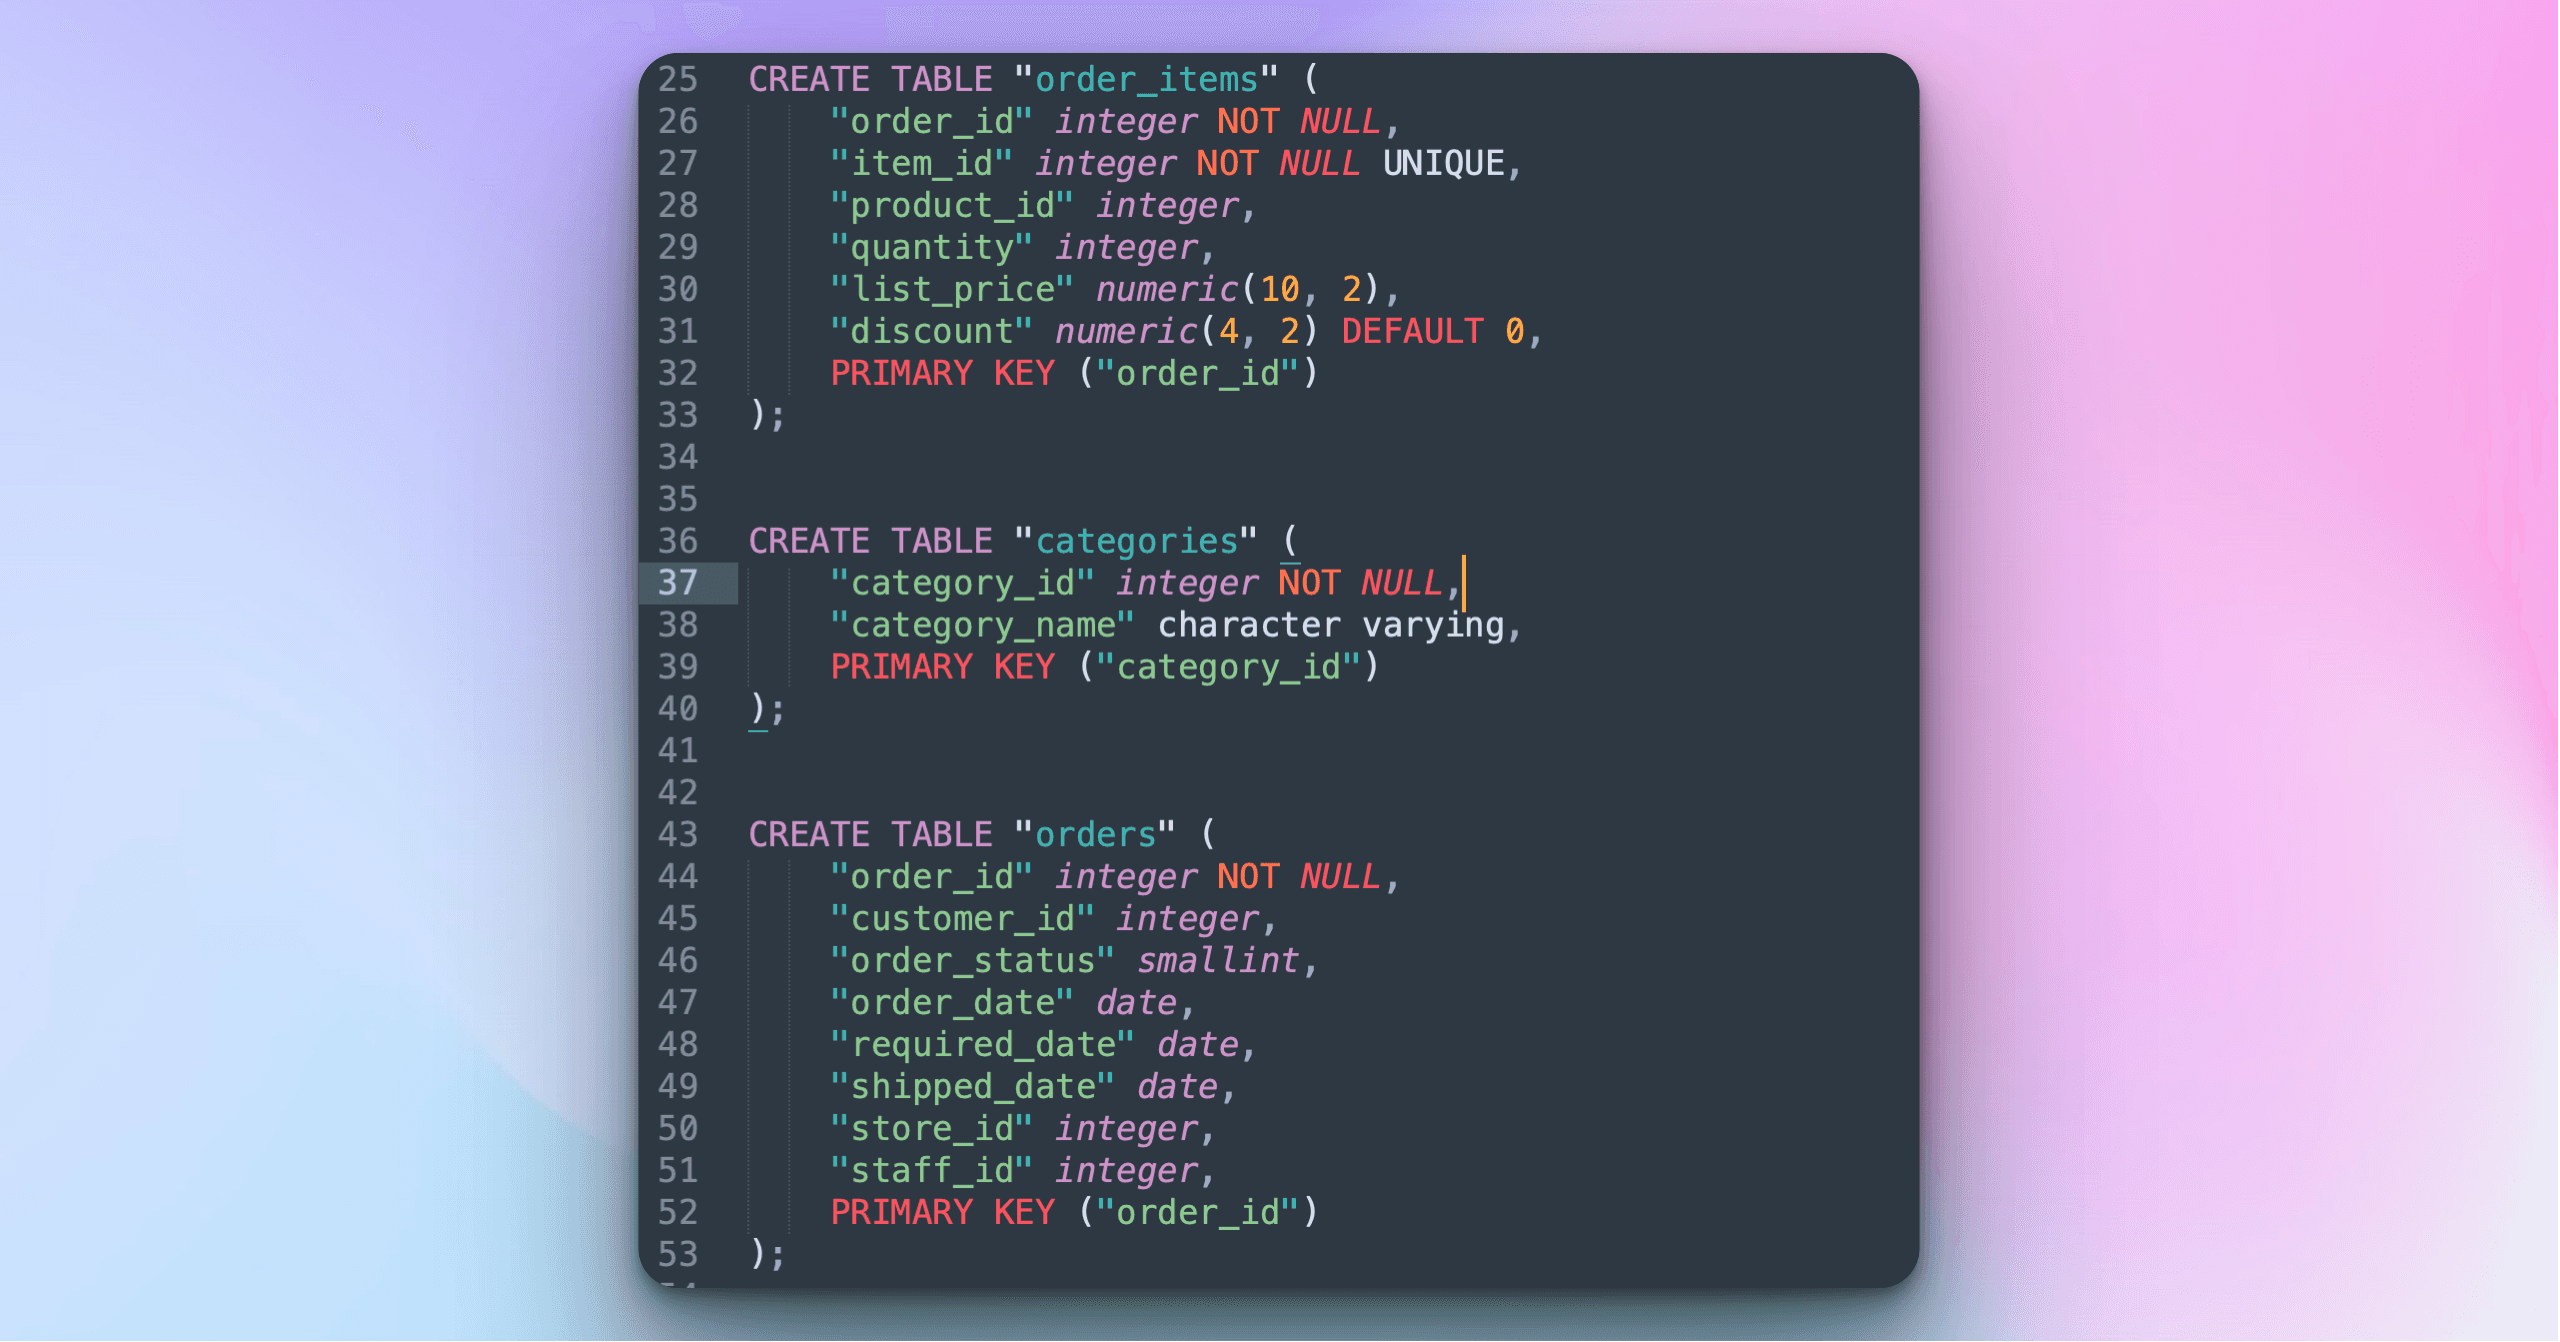
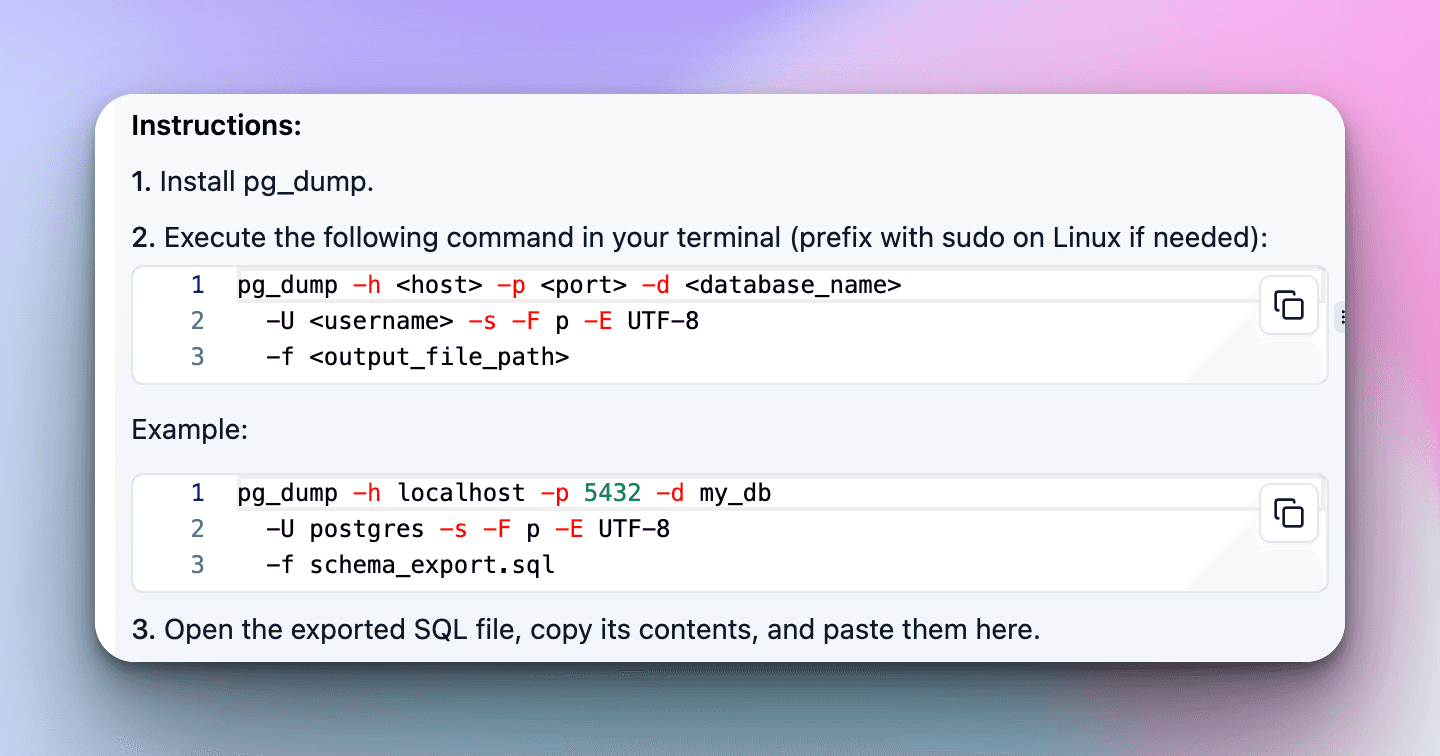
If you don’t have a SQL file yet but have access to the actual database, you can use tools like mysqldump or pg_dump to extract the schema without the data.
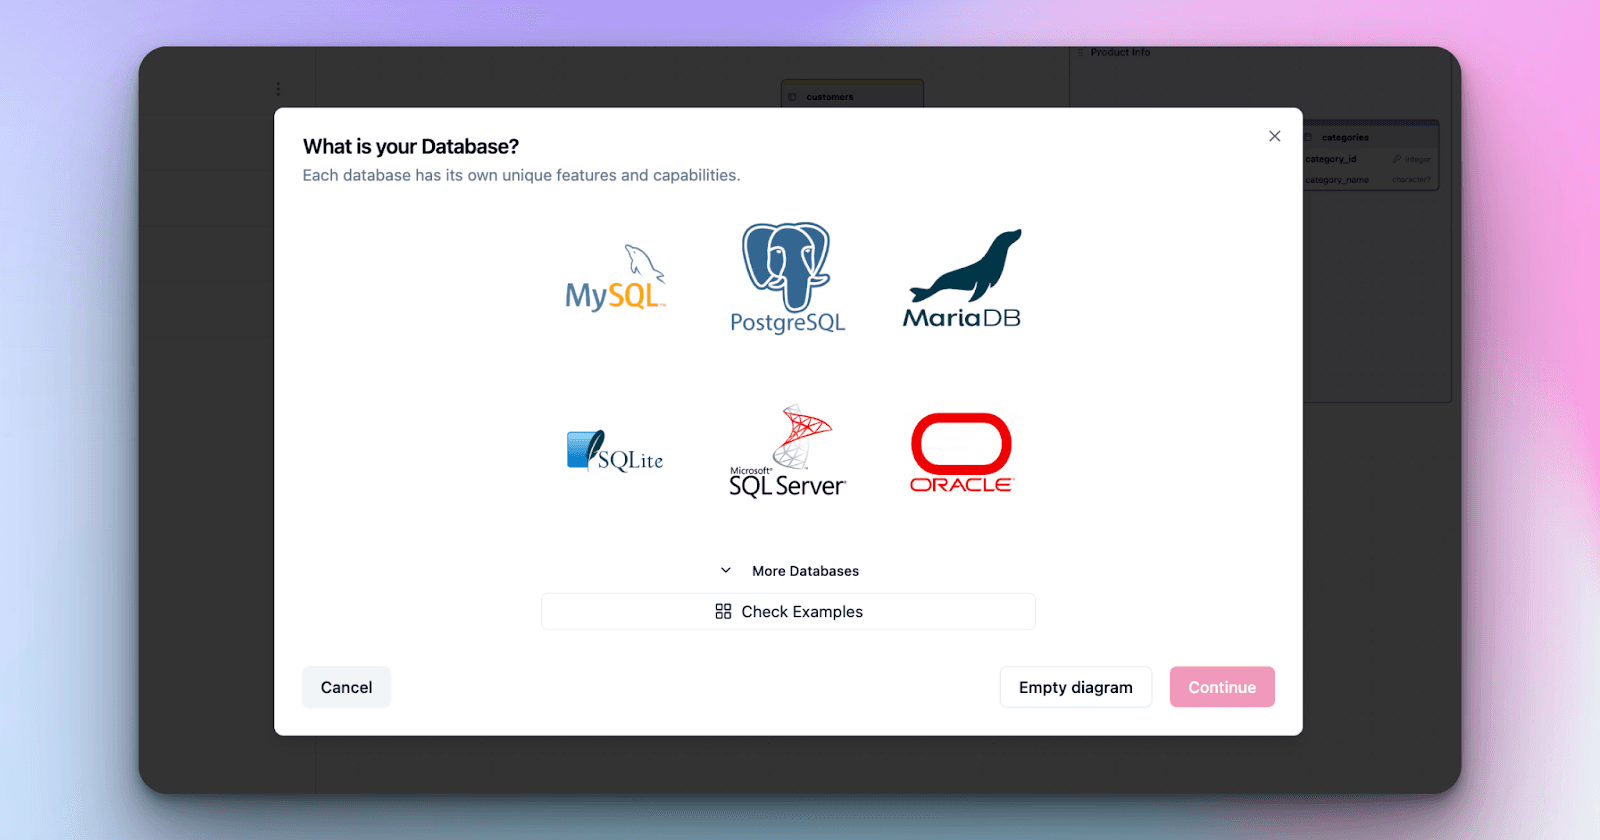
Step 2: Log In to ChartDB and Create a New Diagram
Go to chartdb.io, log in, and click on “New Diagram.” You’ll be asked to choose your database type (like MySQL, PostgreSQL, SQL Server, etc). This helps ChartDB tailor the import instructions to match your setup.
Next, ChartDB will offer you two easy ways to bring in your schema:
Run a ready-made SQL script that extracts the structure from a live database
Copy your DDL(SQL creation script) if you already have a SQL file with
CREATE TABLEstatements
Choose the method that fits your situation. Both paths are simple and give you a fast way to move from raw SQL to a clear diagram.
To run a ready-made SQL script to extract your schema from a live database. ChartDB will give you a custom query to run. This is the only query you’ll need to copy and run on your database to extract the structure. Don’t worry, you don’t need to understand it. Use your database client for it (Postico, DBeaver, Beekeeper Studio, SSMS, Azure Data Studio or anything you like).
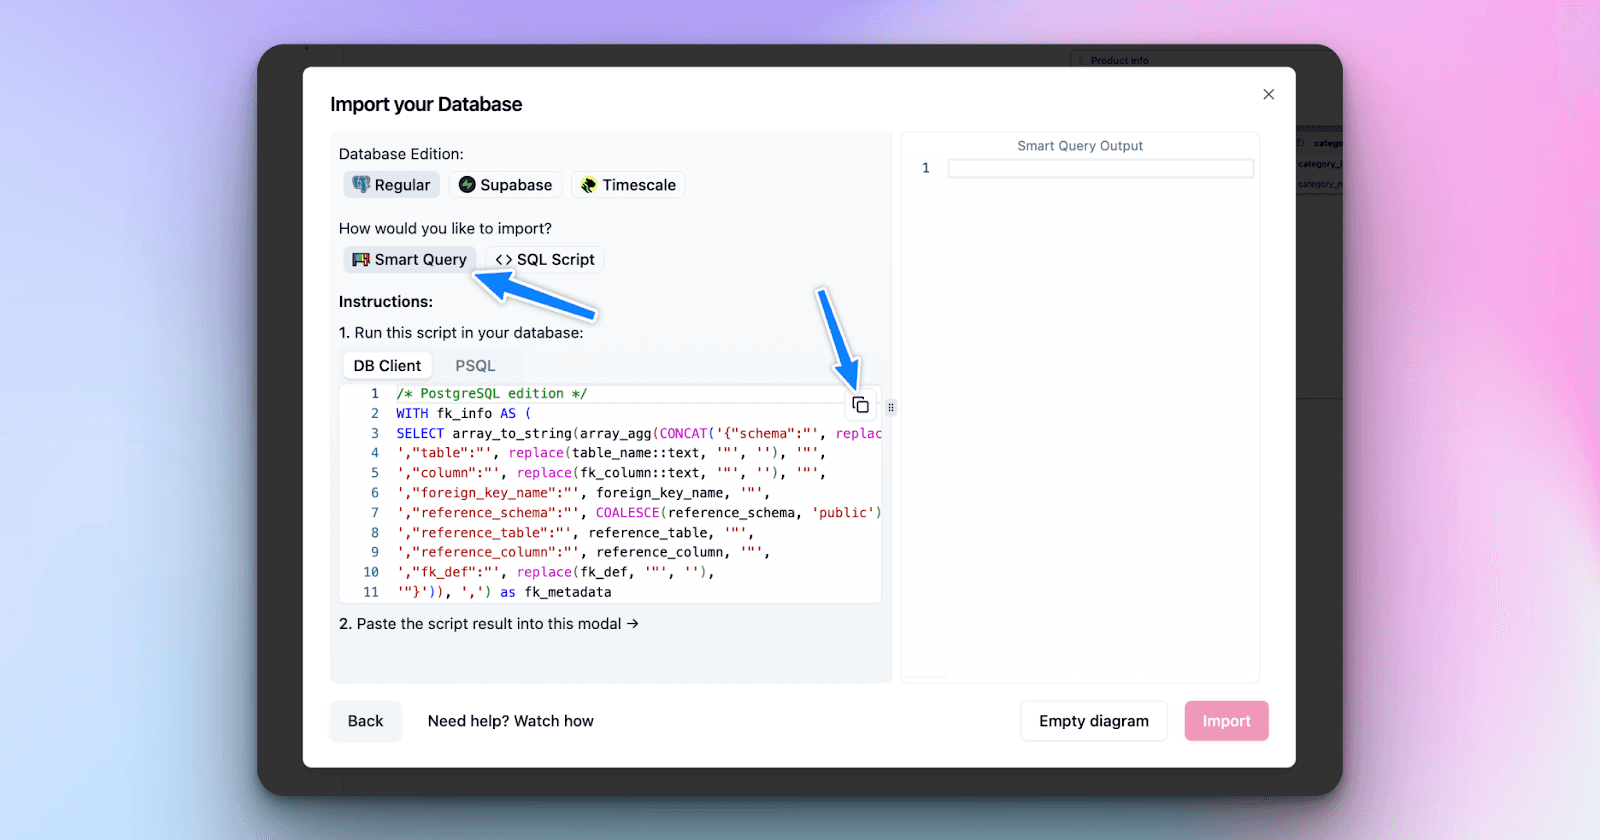
And the second option is to choose SQL Script and copy if you already have a SQL file with the CREATE TABLE statements
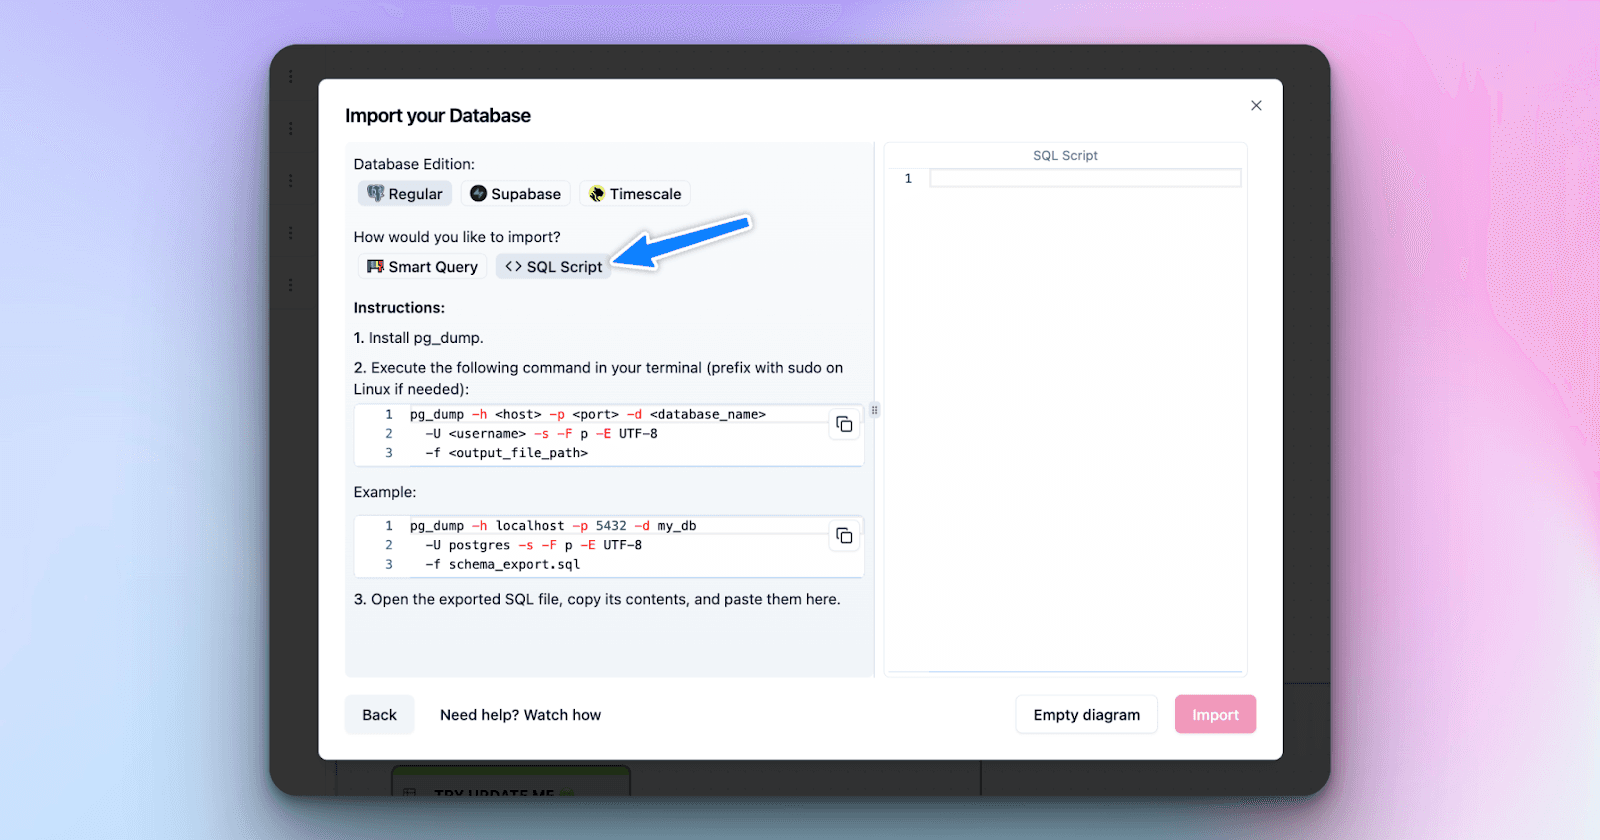
Both methods are designed to be quick and easy, so you can move from SQL to diagram in just a few steps.
Step 3: Import Your Schema into ChartDB
Head back to ChartDB and paste that output into the import box. Click “Check Script Result.” If everything looks good, hit “Import.” In just a few seconds, you’ll see all your tables visualized on the canvas.

If you chose the SQL script method, run the provided query on your database using your preferred SQL client. It will return a JSON-like result. Copy that result and paste it into the import dialog inside ChartDB.
If you chose to paste your SQL Script directly, just copy your SQL creation script and paste it into the same dialog. ChartDB will parse it and build the schema from your CREATE TABLE definitions.
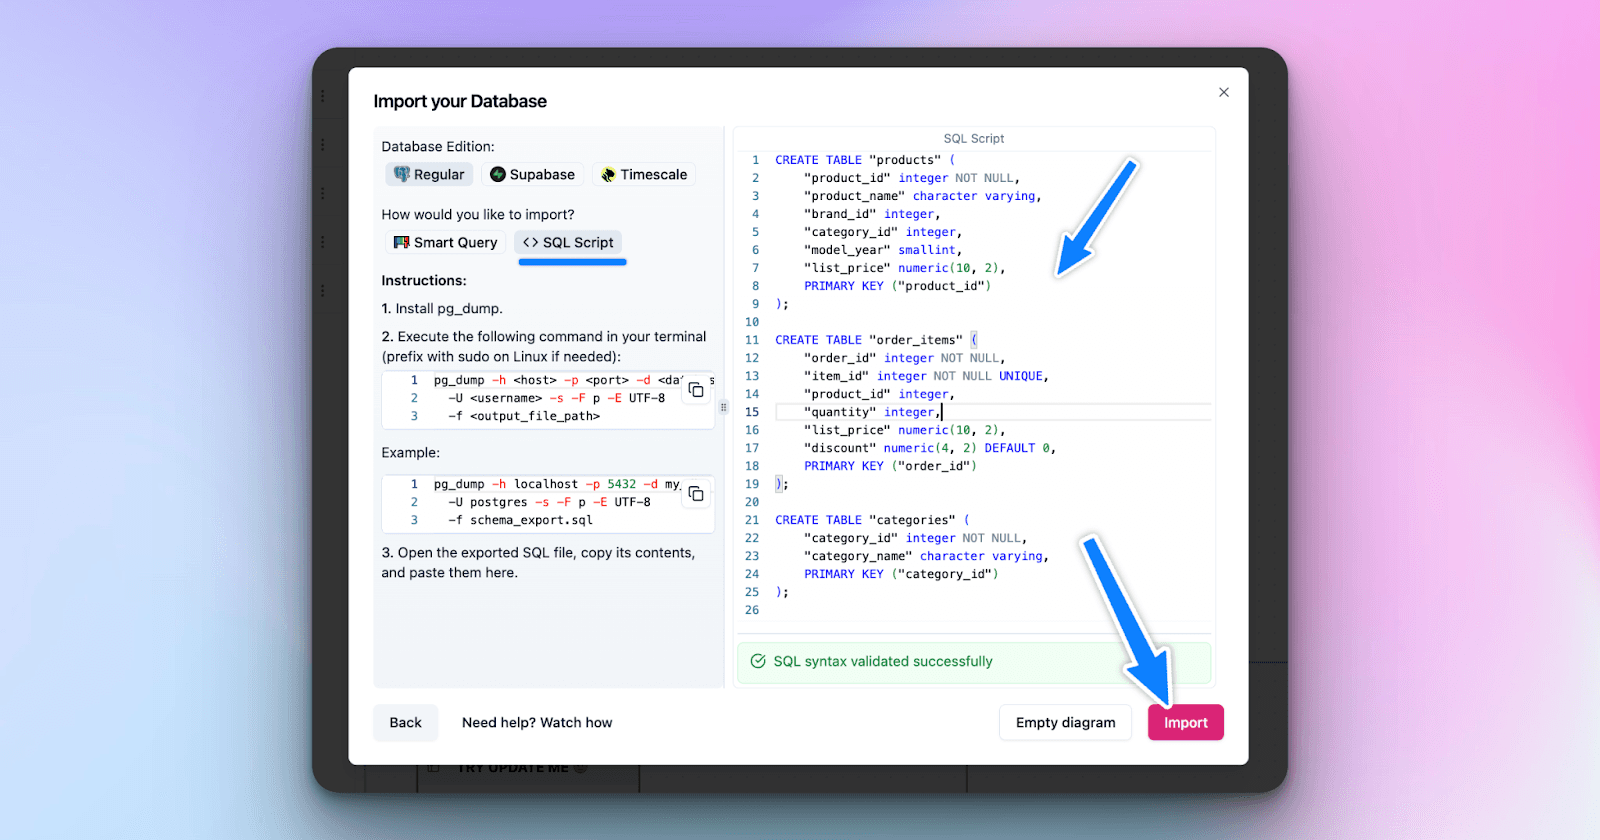
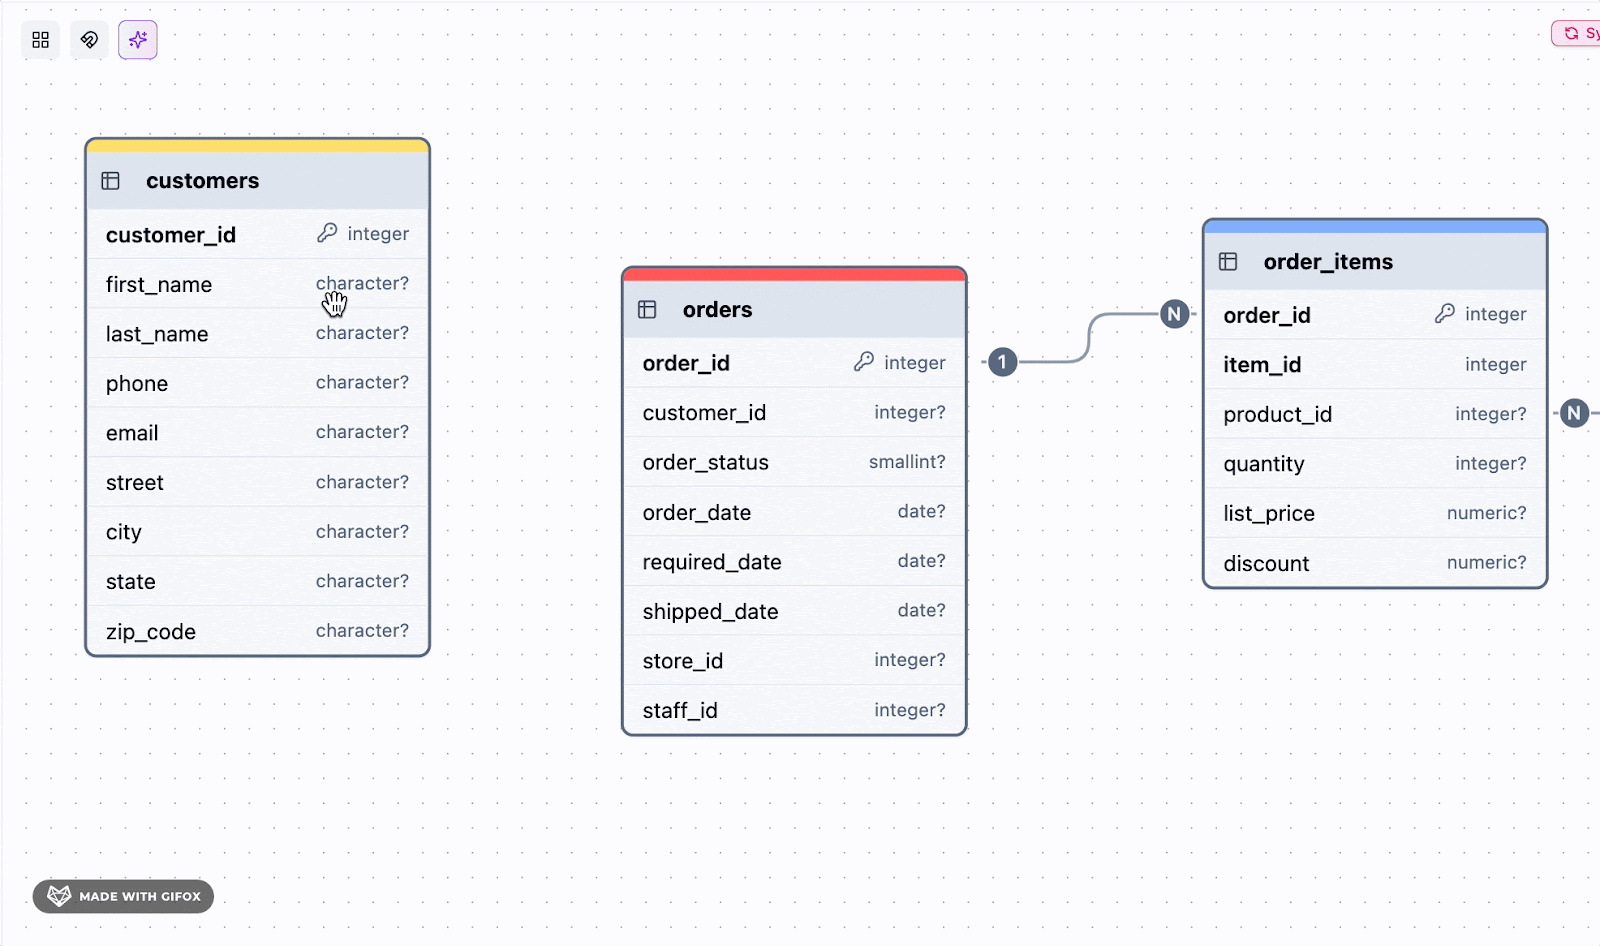
Each table will appear as a box, and if your schema has foreign keys, you’ll see lines connecting the tables to show relationships. If not, that’s totally fine. You can add them manually.
Step 4: Add Missing Relationships
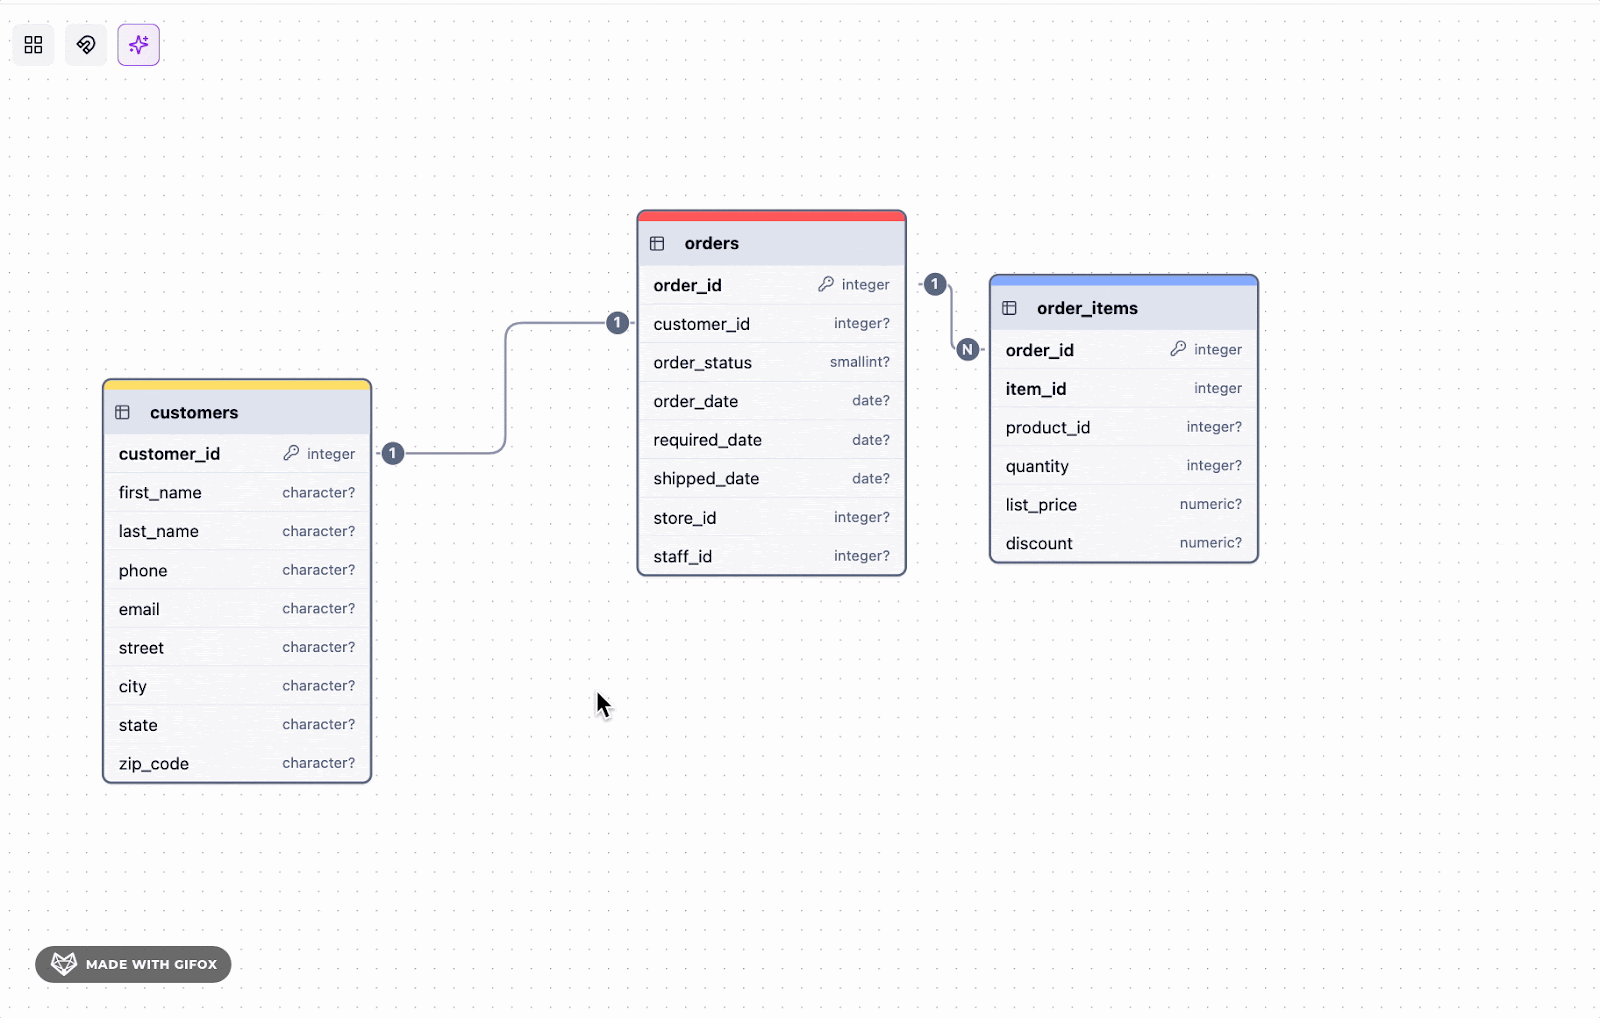
Legacy databases often lack foreign keys. In ChartDB, you can manually connect tables by dragging a line from one column to another. For example, if you know that orders.customer_id connects to customers.id, just create that link.
If you're not sure where all the missing relationships should be, ChartDB can help. Use the built-in AI Assistant to scan your schema and suggest potential foreign key relationships based on column names, types, and naming patterns. This gives you a smart starting point, especially for large or unfamiliar databases.
This combination of manual editing and AI-powered suggestions helps you quickly fill in the gaps and document how things actually work, even if the original schema doesn’t spell it out.
Step 5: Organize and Annotate
Drag your tables around to make the diagram easier to read. Group related tables, adjust layouts, and even add notes. One powerful way to organize your diagram is by using Areas (also known as table groups). Areas let you categorize tables that belong to the same logical part of the system, making your diagram much cleaner and easier to understand.
For example, you can group all authentication-related tables like users, sessions, and password_resets into an area called Auth. Similarly, you might group orders, order_items, and payments into an area called Billing.
This helps reduce clutter, makes patterns more visible, and allows teammates to quickly grasp how different parts of the database are structured.
For instance, you might leave a comment like “This table was deprecated in 2017” or “Used only for exports.”
The goal is to make your ERD not just accurate but actually helpful when sharing with teammates or reviewing it later.
Take HR databases, for example: grouping employee_salaries, bonus_payments, and benefits_enrollment tables into a compensation area creates clear visual relationships between components that integrate seamlessly with modern compensation planning solutions.
Step 6: Save, Export, and Share
Once your diagram looks good, you can export it as an image, save it to your account, or share it with your team. If you're working on a project together, you can even invite collaborators to view or edit the diagram in real time.
ChartDB also lets you generate an embedded link to your diagram. This is great for inserting your ER Diagram directly into collaborative tools like Miro, Notion, Confluence, internal docs, or wikis. Your team can see the most up-to-date version without needing to download or re-upload anything.
Prefer a static version? You can also export your diagram as a PNG or SVG image and use it anywhere you need a visual snapshot.
ChartDB makes this super simple. No need for shared screenshots or clunky Visio files.
Conclusion
If you’re working with a legacy SQL schema, generating an ERD doesn’t need to be a manual or frustrating process. Modern tools like ChartDB make it quick, clean, and collaborative.
You don’t need to reverse engineer hundreds of lines of SQL or guess how tables connect. Just upload your schema, and ChartDB gives you a visual map in seconds.
We have a lot of database schema templates as an examples for MySQL or PostgresSQL, do check them out too.
Try it out for yourself.
Sign up for ChartDB now and generate your first ERD for free.

It's the fastest way to go from confusion to clarity, and your future self (and your team) will thank you.
More resources
To explore related topics around ER diagrams, database relationships, and schema organization, check out these blogs:
Ever inherited a database with zero documentation?
You open up a SQL file from a former developer working on the project that you are assigned to now, and you see a ton of table definitions, unfamiliar column names, and no clue how the pieces connect.
Well, if this is something that if it sounds familiar, you’re not alone.
Now there’s a quick way to turn a legacy SQL schema into a clear visual map that you can share with your team & this guide will tell you how to do that right.
Just before getting into the real deal, a little about me ⬇️
I'm Jonathan, founder of ChartDB (An SQL Database Visualizer). After years of working with databases across all kinds of systems and industries, I've seen the same challenge pop up again and again: trying to make sense of a tangled schema with no foreign keys and zero documentation. So I, with my partner, built ChartDB to fix that.
In this post, I’ll walk you through the simplest way to generate an ERD from a SQL file using ChartDB. Whether you're trying to onboard faster, plan a migration, or just get a mental model of how things fit together, this process will save you hours of frustration.
What You Need To Start Building an ERD from SQL
Here’s a short checklist to make sure you’re ready:
A SQL schema file
Usually a .sql file withCREATE TABLEstatements and, if you’re lucky, some foreign keys.A text editor / SQL Client
VS Code, Notepad++, or anything you like. This helps with quick edits or checking what’s inside the file. Or Postico, DBeaver, Beekeeper Studio, SSMS, Azure Data Studio or anything you like.Access to chartdb.io
Head over to chartdb.io, sign up for free, and you’re ready to go. No installation needed.
6 Quick Steps To Generate an ERD
You can generate ERDs using different ERD tools. The walkthrough below shows how you can create one easily and effortlessly using ChartDB.
Check out this quick video walkthrough👇
Read further, if you prefer understanding via text.
Step 1: Take a Quick Look at Your SQL File
Open your SQL file in a text editor and check if it includes the CREATE TABLE statements. If you're dealing with a legacy system, chances are there won’t be many foreign keys, and that’s okay. You can still visualize the structure and add relationships manually later. While reviewing queries, you can use the SQL LIKE Pattern Tester to quickly understand wildcard patterns.
If you don’t have a SQL file yet but have access to the actual database, you can use tools like mysqldump or pg_dump to extract the schema without the data.
Step 2: Log In to ChartDB and Create a New Diagram
Go to chartdb.io, log in, and click on “New Diagram.” You’ll be asked to choose your database type (like MySQL, PostgreSQL, SQL Server, etc). This helps ChartDB tailor the import instructions to match your setup.
Next, ChartDB will offer you two easy ways to bring in your schema:
Run a ready-made SQL script that extracts the structure from a live database
Copy your DDL(SQL creation script) if you already have a SQL file with
CREATE TABLEstatements
Choose the method that fits your situation. Both paths are simple and give you a fast way to move from raw SQL to a clear diagram.
To run a ready-made SQL script to extract your schema from a live database. ChartDB will give you a custom query to run. This is the only query you’ll need to copy and run on your database to extract the structure. Don’t worry, you don’t need to understand it. Use your database client for it (Postico, DBeaver, Beekeeper Studio, SSMS, Azure Data Studio or anything you like).
And the second option is to choose SQL Script and copy if you already have a SQL file with the CREATE TABLE statements
Both methods are designed to be quick and easy, so you can move from SQL to diagram in just a few steps.
Step 3: Import Your Schema into ChartDB
Head back to ChartDB and paste that output into the import box. Click “Check Script Result.” If everything looks good, hit “Import.” In just a few seconds, you’ll see all your tables visualized on the canvas.
If you chose the SQL script method, run the provided query on your database using your preferred SQL client. It will return a JSON-like result. Copy that result and paste it into the import dialog inside ChartDB.
If you chose to paste your SQL Script directly, just copy your SQL creation script and paste it into the same dialog. ChartDB will parse it and build the schema from your CREATE TABLE definitions.
Each table will appear as a box, and if your schema has foreign keys, you’ll see lines connecting the tables to show relationships. If not, that’s totally fine. You can add them manually.
Step 4: Add Missing Relationships
Legacy databases often lack foreign keys. In ChartDB, you can manually connect tables by dragging a line from one column to another. For example, if you know that orders.customer_id connects to customers.id, just create that link.
If you're not sure where all the missing relationships should be, ChartDB can help. Use the built-in AI Assistant to scan your schema and suggest potential foreign key relationships based on column names, types, and naming patterns. This gives you a smart starting point, especially for large or unfamiliar databases.
This combination of manual editing and AI-powered suggestions helps you quickly fill in the gaps and document how things actually work, even if the original schema doesn’t spell it out.
Step 5: Organize and Annotate
Drag your tables around to make the diagram easier to read. Group related tables, adjust layouts, and even add notes. One powerful way to organize your diagram is by using Areas (also known as table groups). Areas let you categorize tables that belong to the same logical part of the system, making your diagram much cleaner and easier to understand.
For example, you can group all authentication-related tables like users, sessions, and password_resets into an area called Auth. Similarly, you might group orders, order_items, and payments into an area called Billing.
This helps reduce clutter, makes patterns more visible, and allows teammates to quickly grasp how different parts of the database are structured.
For instance, you might leave a comment like “This table was deprecated in 2017” or “Used only for exports.”
The goal is to make your ERD not just accurate but actually helpful when sharing with teammates or reviewing it later.
Take HR databases, for example: grouping employee_salaries, bonus_payments, and benefits_enrollment tables into a compensation area creates clear visual relationships between components that integrate seamlessly with modern compensation planning solutions.
Step 6: Save, Export, and Share
Once your diagram looks good, you can export it as an image, save it to your account, or share it with your team. If you're working on a project together, you can even invite collaborators to view or edit the diagram in real time.
ChartDB also lets you generate an embedded link to your diagram. This is great for inserting your ER Diagram directly into collaborative tools like Miro, Notion, Confluence, internal docs, or wikis. Your team can see the most up-to-date version without needing to download or re-upload anything.
Prefer a static version? You can also export your diagram as a PNG or SVG image and use it anywhere you need a visual snapshot.
ChartDB makes this super simple. No need for shared screenshots or clunky Visio files.
Conclusion
If you’re working with a legacy SQL schema, generating an ERD doesn’t need to be a manual or frustrating process. Modern tools like ChartDB make it quick, clean, and collaborative.
You don’t need to reverse engineer hundreds of lines of SQL or guess how tables connect. Just upload your schema, and ChartDB gives you a visual map in seconds.
We have a lot of database schema templates as an examples for MySQL or PostgresSQL, do check them out too.
Try it out for yourself.
Sign up for ChartDB now and generate your first ERD for free.
It's the fastest way to go from confusion to clarity, and your future self (and your team) will thank you.
More resources
To explore related topics around ER diagrams, database relationships, and schema organization, check out these blogs:

Continue Reading


© 2026 ChartDB
Product
Free Tools
© 2025 ChartDB
Product
Free Tools
© 2025 ChartDB