
Mar 3, 2026
Data Modeling in SQL: What It Is, Types, and How to Do It
Data Modeling in SQL: What It Is, Types, and How to Do It
Data Modeling in SQL: What It Is, Types, and How to Do It
In this guide, we explain what data modeling in SQL is, why it matters, and how to apply different modeling types in practice.
In this guide, we explain what data modeling in SQL is, why it matters, and how to apply different modeling types in practice.
In this guide, we explain what data modeling in SQL is, why it matters, and how to apply different modeling types in practice.

Jonathan Fishner
6 minutes read
TLDR;
TLDR;
What it is: Data modeling structures your SQL data into organized tables and relationships.
Why it matters: A clear model reduces bugs, improves queries, and keeps your team aligned.
Three levels: Conceptual (big picture), Logical (tables and keys), Physical (SQL-ready schema).
Practical use: Visualizing and refining models helps avoid confusion and supports growth.
How ChartDB helps: Import schemas, see relationships, edit visually, and keep models organized.
A few years ago, I spent days trying to debug a report that kept giving us the wrong numbers. The queries were fine. The database was live. But something felt off. Turns out, the data model was a mess. Tables were duplicated. Relationships were missing. Some columns had three different names depending on where you looked.
That moment stuck with me.
As someone who's built internal data tools at companies like Fiverr, I’ve seen what poor structure can cost. It wastes time, stalls growth, and turns smart teams into spreadsheet firefighters.
That’s part of why we built ChartDB. A visual data modeling and database diagram tool that helps teams structure, explore, and understand their SQL databases without digging through raw schema files.
If you’ve ever had to guess what a column really means or why a join doesn’t return the right result, this post is for you.
What Is Data Modeling in SQL?
Data modeling is the process of organizing and structuring your data in a SQL database. Think of it like planning a building before laying bricks. It defines what tables exist, what each one stores, and how they connect.
The goals are simple:
• Keep your data consistent
• Make it easy to work with
• Help your system grow without breaking
You’ll hear three core pieces show up in every model:
• Entities (the tables like users or orders)
• Attributes (the columns like email or total_amount)
• Relationships (foreign keys that tie tables together)
A solid data model brings all three into harmony.
Why Data Modeling Matters
Good data modeling saves time, reduces bugs, and keeps everyone aligned.
Across different use cases of data modeling, the value of a clear structure becomes obvious.
From a business view, it means:
• Your reports match reality
• You avoid repeated work
• Teams can make decisions faster
From a technical view, it means:
• Queries run faster
• Fewer messy joins
• Less confusion for engineers and analysts
Skip this step, and you’ll feel it:
• Duplicate data that never quite syncs
• Conflicting KPIs across dashboards
• Dashboards that take minutes to load
• Endless migrations that could’ve been avoided
It’s like skipping the blueprint and wondering why the plumbing leaks.
The 3 Types of Data Models
Data modeling usually happens at three levels. Each one adds more detail. Together, they take you from idea to production.
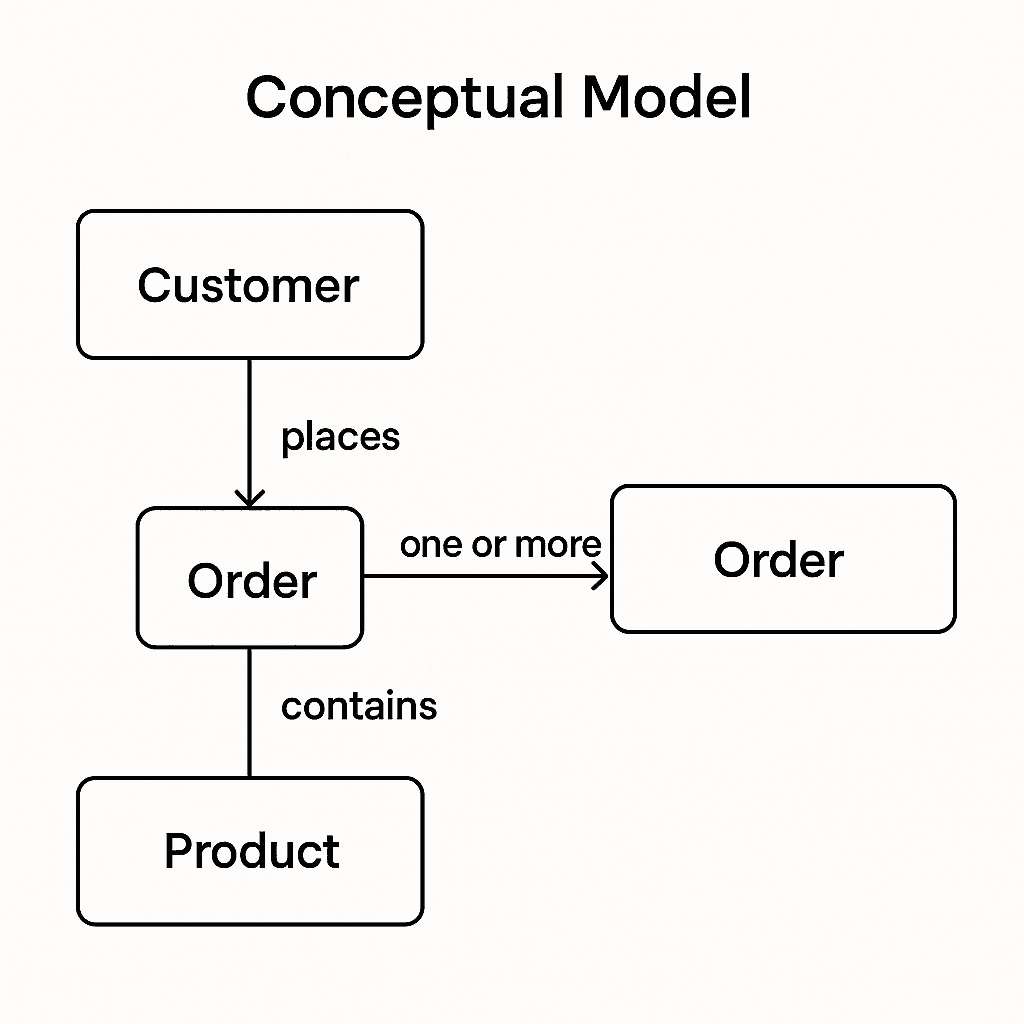
1. Conceptual Model
This is your 10,000-foot view.
It answers: What are the main things we’re storing, and how are they connected?
At this stage, you might sketch something like:
• A Customer places one or more Orders
• Each Order contains one or more Products
No data types. No primary keys. Just big ideas.
This is the kind of thing you might draw on a whiteboard during a meeting.
2. Logical Model
Now we get into the structure.
We define:
• Tables like customers, orders, products• Primary keys (customer_id, order_id)
• Foreign keys (like orders.customer_id)
• Relationships and cardinality (one-to-many, many-to-many)
It’s still platform-agnostic. You’re not deciding on VARCHAR(255) yet.
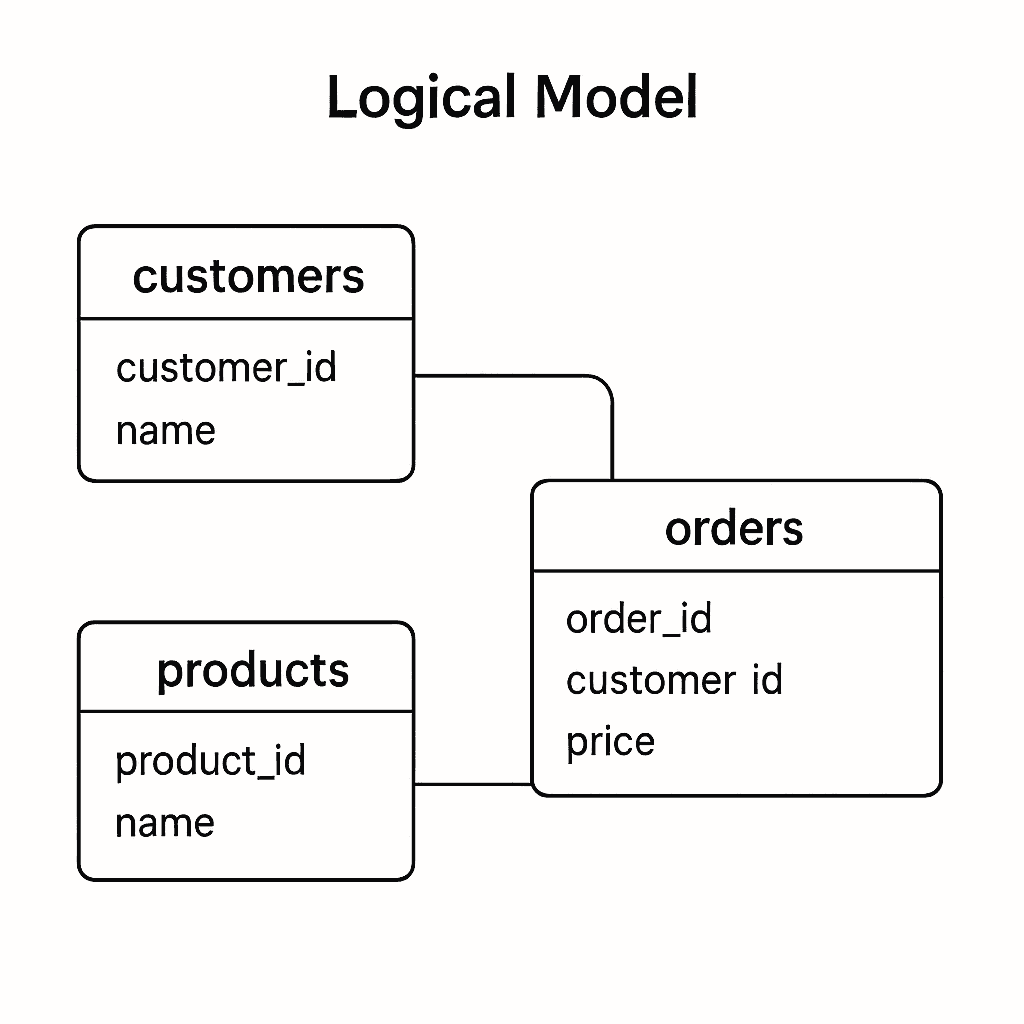
This is where the schema really starts to take shape.
3. Physical Model
This is the implementation. Everything becomes SQL-ready.
Here you define:
• Table and column names
• Data types (VARCHAR, INTEGER, DECIMAL)
• Indexes
• Constraints
• Naming conventions that match your DB engine
Whether you’re using PostgreSQL, MySQL, or SQL Server, this is the stage where details matter, for example, avoiding reserved words like order as table names.
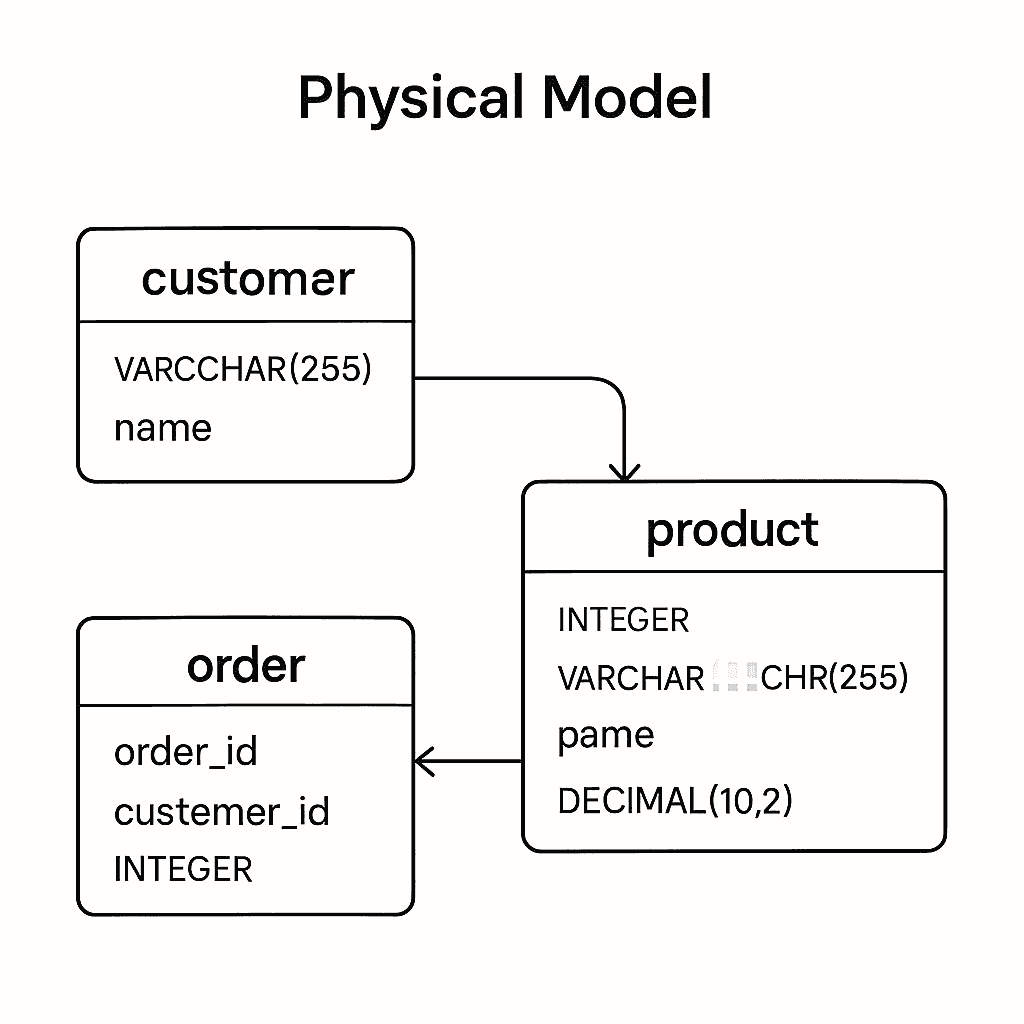
This model gets translated into your actual database schema.
How to Use ChartDB for Data Modeling
ChartDB was built to make this process way simpler.
Here’s how:
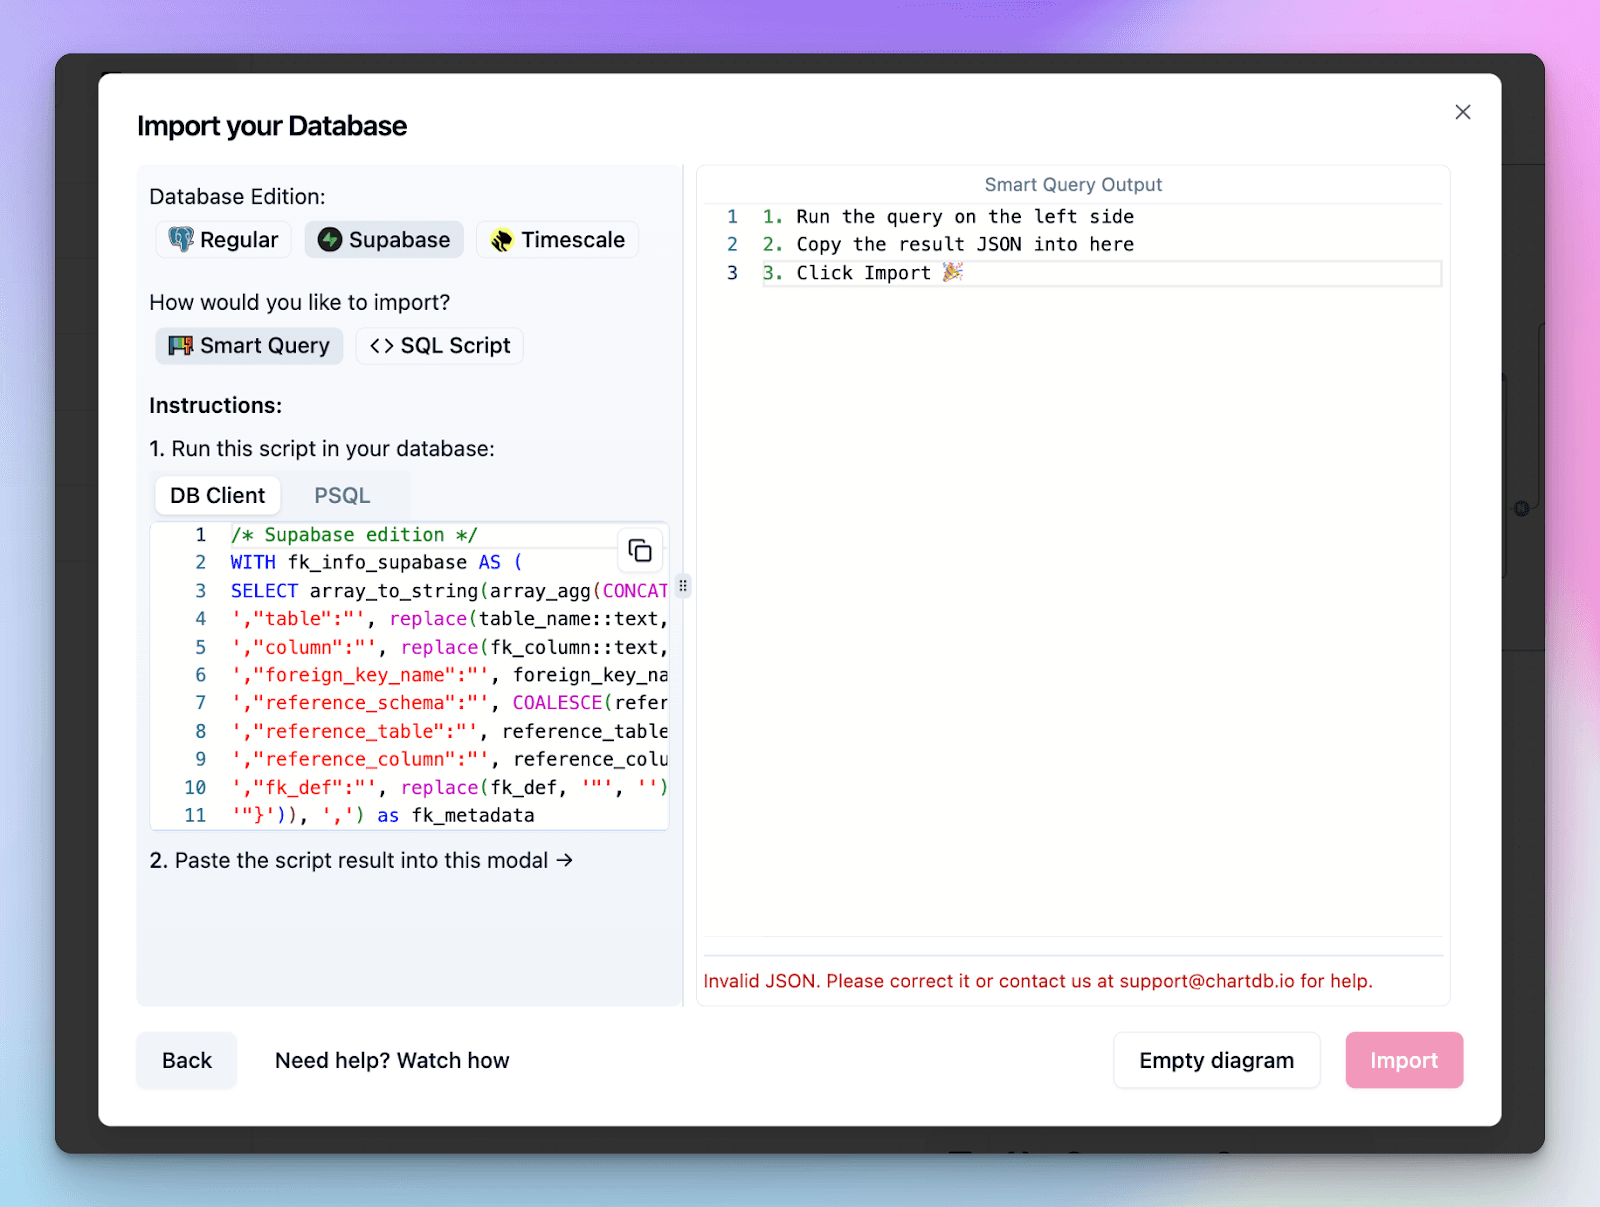
1. Import your schema
Run one command. Paste the output. You’ll get an instant ER diagram - no setup, no credentials.
Want a deeper look at how this works? I have created a guide on generating ER diagrams using AI in ChartDB.
👉 Try it here: https://chartdb.io
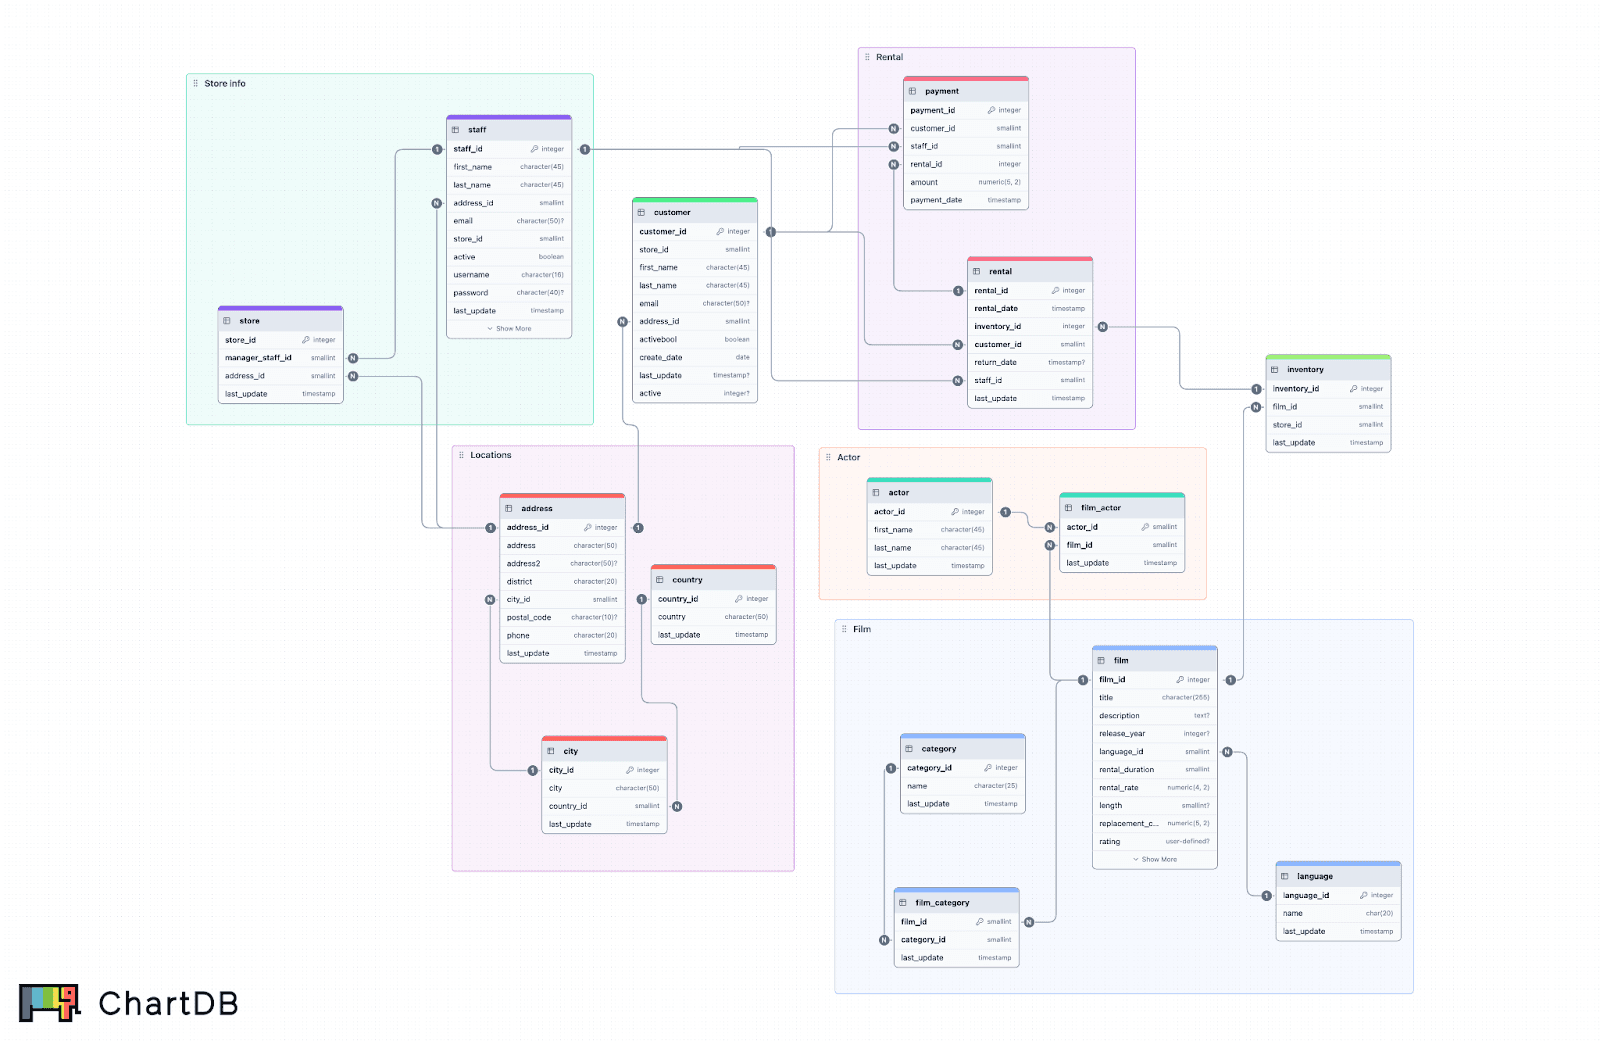
2. See relationships right away
We auto-detect foreign keys and draw out the links between tables. You can instantly spot missing connections or surprises in your schema.
To know more, check out the ChartDB documentation on creating and managing relationships with foreign keys.
3. Edit visually
Add tables, columns, or relationships with a click. No need to write SQL just to plan things out.
4. Stay organized
Use areas to group tables. Annotate your schema. Export images or share it with your team.
Organizing your database schema diagram helps keep complex systems readable and structured, especially as your schema grows.
ChartDB helps you go from chaos to clarity in minutes. And if you’re onboarding someone new, there’s nothing better than giving them a diagram instead of a data dump. If you’re a data analyst, engineer, or product owner, this makes understanding your schema much easier.
ChartDB also makes data modeling simple and visual. Data modeling is the way you organize and structure your data so you can clearly see what each table stores and how everything connects, like planning a building before laying the bricks.
A good model helps teams avoid confusion, keep data consistent, and make better decisions faster. With ChartDB you can import your schema, instantly see relationships, and refine your design visually turning abstract structure into shared diagrams that everyone on your team can understand.
Conclusion
That broken report I mentioned earlier? It took days to untangle. But once we sat down and re-modeled the data from scratch, everything changed. Queries got faster. Reports lined up. The team stopped arguing over which column was the right one. Plus, we also have a set of free SQL tools you can use to experiment with schemas and queries.
If there’s one takeaway, it’s this:
Better models lead to better decisions.
Poor data modeling costs more than just performance. It creates confusion, kills trust, and slows you down.
You don’t need to accept that as normal. Start modeling your SQL database with ChartDB today. It’s fast, visual, and free to try.
FAQ
Q: Why use ChartDB.io for data modeling instead of SQLDBM?
ChartDB focuses on fast schema visualization, instant ER diagrams, and a clean workflow without requiring complex setup. It’s built for teams who want clarity and speed when working with SQL schemas. The best tool ultimately depends on your workflow, but ChartDB emphasizes simplicity and visual understanding.
Q: Can data modeling prevent future migration issues?
Yes. A well-planned data model makes schema changes, scaling, and migrations significantly easier over time.
Additional Resources
• How To Generate ERD from SQL
• Best Cloud Data Modeling Tools
• Data Modeling for ClickHouse: Optimize Schemas
•Design Effective Schemas for Google BigQuery
A few years ago, I spent days trying to debug a report that kept giving us the wrong numbers. The queries were fine. The database was live. But something felt off. Turns out, the data model was a mess. Tables were duplicated. Relationships were missing. Some columns had three different names depending on where you looked.
That moment stuck with me.
As someone who's built internal data tools at companies like Fiverr, I’ve seen what poor structure can cost. It wastes time, stalls growth, and turns smart teams into spreadsheet firefighters.
That’s part of why we built ChartDB. A visual data modeling and database diagram tool that helps teams structure, explore, and understand their SQL databases without digging through raw schema files.
If you’ve ever had to guess what a column really means or why a join doesn’t return the right result, this post is for you.
What Is Data Modeling in SQL?
Data modeling is the process of organizing and structuring your data in a SQL database. Think of it like planning a building before laying bricks. It defines what tables exist, what each one stores, and how they connect.
The goals are simple:
• Keep your data consistent
• Make it easy to work with
• Help your system grow without breaking
You’ll hear three core pieces show up in every model:
• Entities (the tables like users or orders)
• Attributes (the columns like email or total_amount)
• Relationships (foreign keys that tie tables together)
A solid data model brings all three into harmony.
Why Data Modeling Matters
Good data modeling saves time, reduces bugs, and keeps everyone aligned.
Across different use cases of data modeling, the value of a clear structure becomes obvious.
From a business view, it means:
• Your reports match reality
• You avoid repeated work
• Teams can make decisions faster
From a technical view, it means:
• Queries run faster
• Fewer messy joins
• Less confusion for engineers and analysts
Skip this step, and you’ll feel it:
• Duplicate data that never quite syncs
• Conflicting KPIs across dashboards
• Dashboards that take minutes to load
• Endless migrations that could’ve been avoided
It’s like skipping the blueprint and wondering why the plumbing leaks.
The 3 Types of Data Models
Data modeling usually happens at three levels. Each one adds more detail. Together, they take you from idea to production.
1. Conceptual Model
This is your 10,000-foot view.
It answers: What are the main things we’re storing, and how are they connected?
At this stage, you might sketch something like:
• A Customer places one or more Orders
• Each Order contains one or more Products
No data types. No primary keys. Just big ideas.
This is the kind of thing you might draw on a whiteboard during a meeting.
2. Logical Model
Now we get into the structure.
We define:
• Tables like customers, orders, products• Primary keys (customer_id, order_id)
• Foreign keys (like orders.customer_id)
• Relationships and cardinality (one-to-many, many-to-many)
It’s still platform-agnostic. You’re not deciding on VARCHAR(255) yet.
This is where the schema really starts to take shape.
3. Physical Model
This is the implementation. Everything becomes SQL-ready.
Here you define:
• Table and column names
• Data types (VARCHAR, INTEGER, DECIMAL)
• Indexes
• Constraints
• Naming conventions that match your DB engine
Whether you’re using PostgreSQL, MySQL, or SQL Server, this is the stage where details matter, for example, avoiding reserved words like order as table names.
This model gets translated into your actual database schema.
How to Use ChartDB for Data Modeling
ChartDB was built to make this process way simpler.
Here’s how:
1. Import your schema
Run one command. Paste the output. You’ll get an instant ER diagram - no setup, no credentials.
Want a deeper look at how this works? I have created a guide on generating ER diagrams using AI in ChartDB.
👉 Try it here: https://chartdb.io
2. See relationships right away
We auto-detect foreign keys and draw out the links between tables. You can instantly spot missing connections or surprises in your schema.
To know more, check out the ChartDB documentation on creating and managing relationships with foreign keys.
3. Edit visually
Add tables, columns, or relationships with a click. No need to write SQL just to plan things out.
4. Stay organized
Use areas to group tables. Annotate your schema. Export images or share it with your team.
Organizing your database schema diagram helps keep complex systems readable and structured, especially as your schema grows.
ChartDB helps you go from chaos to clarity in minutes. And if you’re onboarding someone new, there’s nothing better than giving them a diagram instead of a data dump. If you’re a data analyst, engineer, or product owner, this makes understanding your schema much easier.
ChartDB also makes data modeling simple and visual. Data modeling is the way you organize and structure your data so you can clearly see what each table stores and how everything connects, like planning a building before laying the bricks.
A good model helps teams avoid confusion, keep data consistent, and make better decisions faster. With ChartDB you can import your schema, instantly see relationships, and refine your design visually turning abstract structure into shared diagrams that everyone on your team can understand.
Conclusion
That broken report I mentioned earlier? It took days to untangle. But once we sat down and re-modeled the data from scratch, everything changed. Queries got faster. Reports lined up. The team stopped arguing over which column was the right one. Plus, we also have a set of free SQL tools you can use to experiment with schemas and queries.
If there’s one takeaway, it’s this:
Better models lead to better decisions.
Poor data modeling costs more than just performance. It creates confusion, kills trust, and slows you down.
You don’t need to accept that as normal. Start modeling your SQL database with ChartDB today. It’s fast, visual, and free to try.
FAQ
Q: Why use ChartDB.io for data modeling instead of SQLDBM?
ChartDB focuses on fast schema visualization, instant ER diagrams, and a clean workflow without requiring complex setup. It’s built for teams who want clarity and speed when working with SQL schemas. The best tool ultimately depends on your workflow, but ChartDB emphasizes simplicity and visual understanding.
Q: Can data modeling prevent future migration issues?
Yes. A well-planned data model makes schema changes, scaling, and migrations significantly easier over time.
Additional Resources
• How To Generate ERD from SQL
• Best Cloud Data Modeling Tools
• Data Modeling for ClickHouse: Optimize Schemas
•Design Effective Schemas for Google BigQuery

Continue Reading


© 2026 ChartDB
Product
Free Tools
© 2025 ChartDB
Product
Free Tools
© 2025 ChartDB