

Feb 25, 2026
What Is a Database Relationship? Types, Pitfalls and How it Works
What Is a Database Relationship? Types, Pitfalls and How it Works
What Is a Database Relationship? Types, Pitfalls and How it Works
This guide explains database relationships with real examples and shows how ChartDB helps you visualize them step by step.
This guide explains database relationships with real examples and shows how ChartDB helps you visualize them step by step.
This guide explains database relationships with real examples and shows how ChartDB helps you visualize them step by step.

Jonathan Fishner
6 minutes read
TLDR;
TLDR;
Database Relationship: Defines how tables connect using primary and foreign keys.
Core Relationship Types: One-to-One, One-to-Many, Many-to-Many, and Self-referencing.
Why It Matters: Keeps data structured, reduces duplication, and simplifies queries.
Common Pitfalls: Missing foreign keys, over-normalising, and unclear table links
How ChartDB Helps: Visualize relationships instantly with ER diagrams and schema views.
Ever struggled with broken joins, scattered tables, or a schema that no one fully understands?
You're not alone. Most bugs I’ve seen in data-heavy apps start with one simple issue: missing or broken relationships between tables.
In this post, I’ll explain what database relationships are, why they matter, and how you can make sense of them in seconds using database diagrams. Stick around, and I’ll show you how we handle this with ChartDB.
I’m Jonathan, co-founder of ChartDB, and I’ve built data tools at companies like Fiverr. I’ve spent more time than I care to admit fixing messy schemas and debugging bad joins. Let’s make this part easier.
What Are Database Relationships?
A database relationship refers to the connection between two tables.
Relationships always exist between tables, and you’ll usually see them enforced through ⬇️
A primary key, which uniquely identifies a row.
A foreign key, which links to a primary key in another table.
Why is this important?
Because without relationships, your data becomes unreliable. You end up with orders that don’t belong to any customer, or comments linked to users who no longer exist.
Relationships keep your data consistent, prevent duplication, and make it easier to query.
4 Types of Relationships
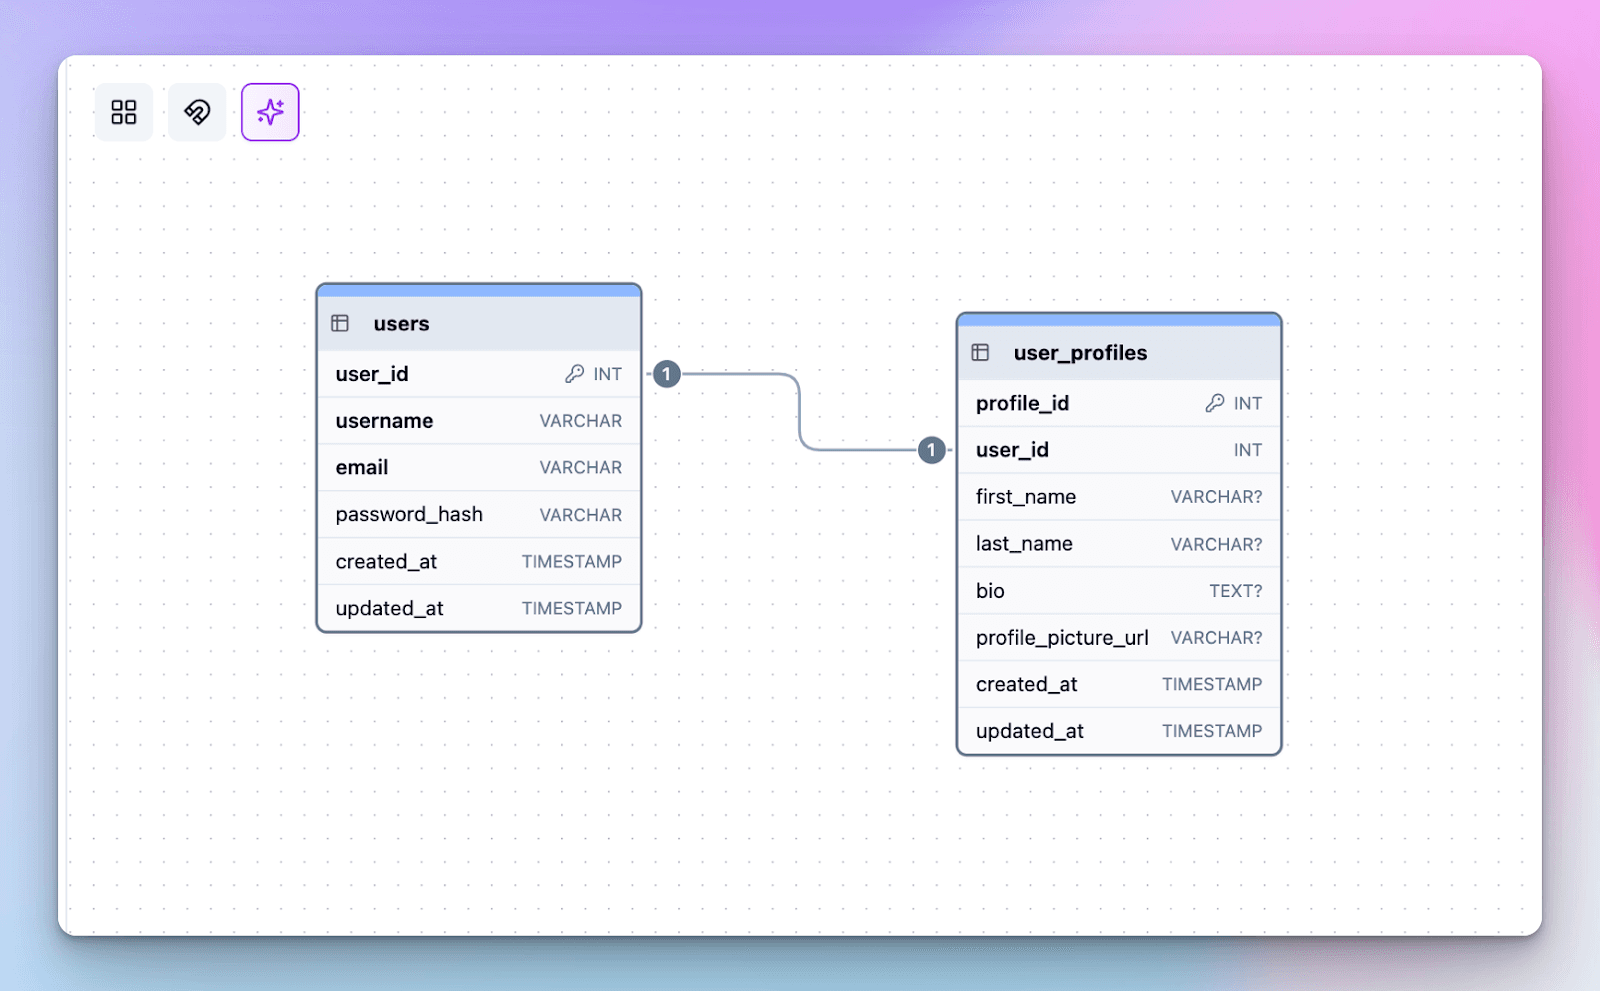
One-to-One
Each row in Table A matches one row in Table B.
Example: users and user_profiles.
One-to-Many
One row in Table A matches many rows in Table B.
Example: customers and orders.

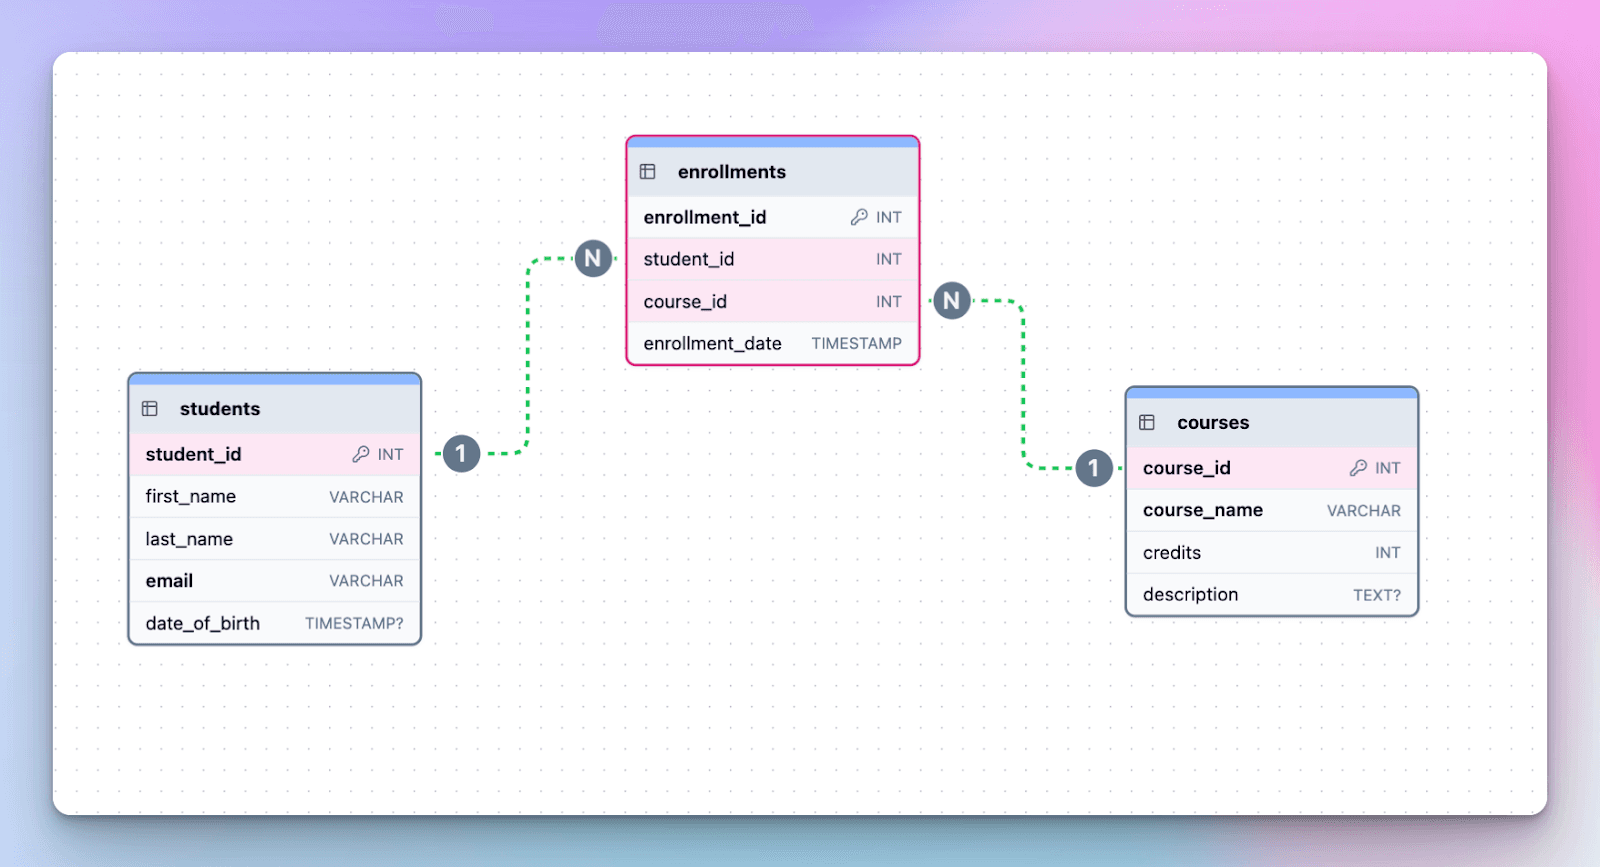
Many-to-Many
Rows in both tables can be linked to many in the other.
Example: students and courses (through an enrollments table).
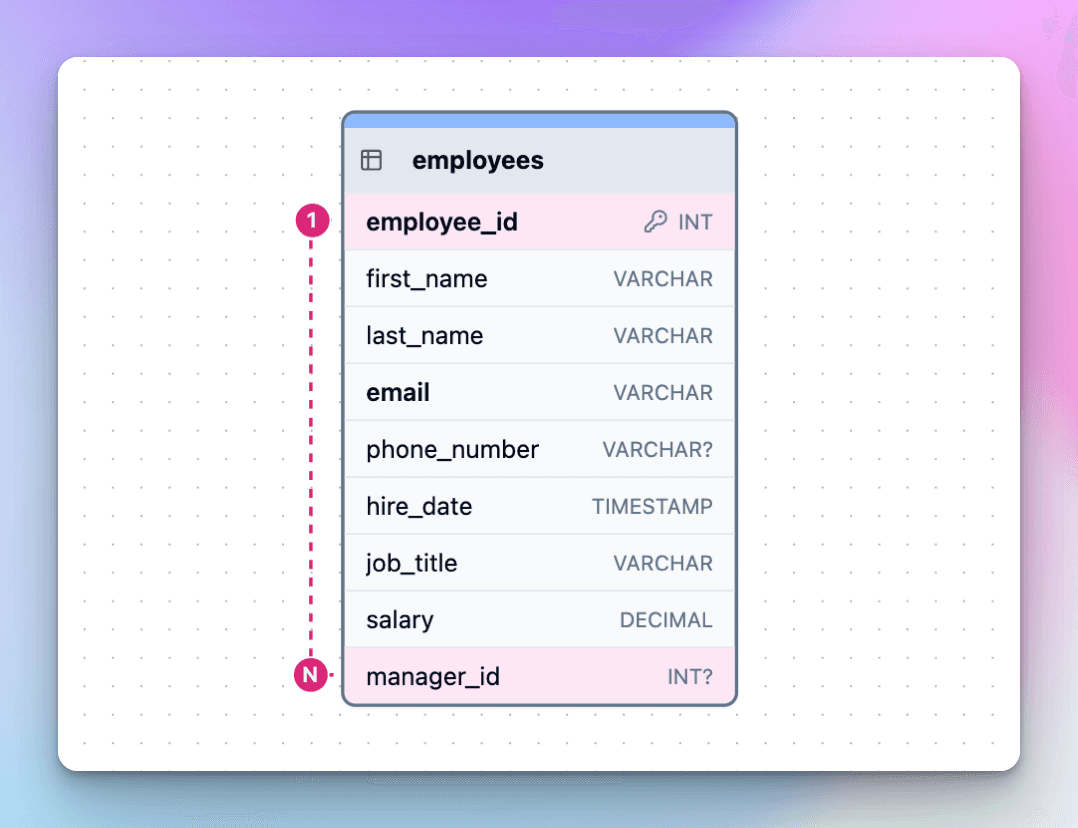
Self-Referencing
A table links to itself.
Example: employees with a manager_id.
Understanding these is easier once you see them visually. Especially when using an ER diagram to map connections between tables.
Common Design Pitfalls:
Missing foreign keys: Tables reference each other in theory, but without actual constraints in the schema, data gets out of sync.
Circular relationships: Tables depend on each other in a way that makes inserts/updates difficult without complex workarounds.
Overuse of many-to-many: Adding join tables everywhere without clear purpose can make queries unnecessarily complex.
Duplicate or inconsistent keys: Using different key formats or data types for related columns leads to broken joins.
Orphan records: Rows in child tables with no valid parent due to poor constraint enforcement.
How to Avoid These Pitfalls:
Always define foreign keys and enforce constraints in the schema.
Review relationship designs early to eliminate circular dependencies.
Use many-to-many relationships sparingly, and only when truly needed.
Standardize key naming, data types, and formats across related tables.
Regularly run integrity checks to detect and remove orphan records.
If you want to go deeper into structural schema problems beyond relationships, check out our guide on common database design mistakes.
Where You'll See This in Real Life
E-commerce: Customers place orders, orders contain products, and products belong to categories. Relationships keep inventory, checkout, and order history accurate without duplicating data.
Healthcare: Patients connect to doctors through appointments. One visit can link medical records, prescriptions, and billing, which is only possible when tables relate cleanly.
SaaS: Teams include users, users create tasks, and permissions control what each person can access. Good relationships make collaboration features scale without messy data structures.
Finance: Accounts hold transactions, transactions roll into portfolios, and reports depend on these links staying consistent and traceable.
Every serious app runs on relationships behind the scenes. When they’re structured properly, queries stay simple and systems scale smoothly. In relational systems, these connections maintain consistency across data, ensuring each relation in the database stays properly linked.
How to Work With Relationships in ChartDB
We built ChartDB so you can go from confusion to clarity in seconds. Below is a small video walkthrough of how you can use it.
Step 1: Import your schema
Run our one-line SQL query and paste the result into ChartDB.
Step 2: See your diagram
ChartDB automatically draws lines between tables using your foreign keys.
Step 3: Edit or add relationships
Each DB relationship you create is reflected instantly in the visual diagram.
If you want a step-by-step check out how to create relationships using foreign keys.
Step 4: Clean things up
Group related tables into areas, reposition them, and add notes. You can also explore ChartDB’s free SQL tools if you want to experiment further with schemas and relationships.
Why This Is Worth It
Good relationships mean:
Fewer bugs
Easier queries
Better collaboration
Clean and clear data
I built ChartDB because I kept encountering messy schemas that took hours to comprehend. I wanted a way to make sense of everything quickly, without digging through endless SQL or outdated docs.
If that sounds familiar, try it out here 👉 https://app.chartdb.io
It’s free to use, and it might just save your team a lot of time.
Additional Resources
Ever struggled with broken joins, scattered tables, or a schema that no one fully understands?
You're not alone. Most bugs I’ve seen in data-heavy apps start with one simple issue: missing or broken relationships between tables.
In this post, I’ll explain what database relationships are, why they matter, and how you can make sense of them in seconds using database diagrams. Stick around, and I’ll show you how we handle this with ChartDB.
I’m Jonathan, co-founder of ChartDB, and I’ve built data tools at companies like Fiverr. I’ve spent more time than I care to admit fixing messy schemas and debugging bad joins. Let’s make this part easier.
What Are Database Relationships?
A database relationship refers to the connection between two tables.
Relationships always exist between tables, and you’ll usually see them enforced through ⬇️
A primary key, which uniquely identifies a row.
A foreign key, which links to a primary key in another table.
Why is this important?
Because without relationships, your data becomes unreliable. You end up with orders that don’t belong to any customer, or comments linked to users who no longer exist.
Relationships keep your data consistent, prevent duplication, and make it easier to query.
4 Types of Relationships
One-to-One
Each row in Table A matches one row in Table B.
Example: users and user_profiles.
One-to-Many
One row in Table A matches many rows in Table B.
Example: customers and orders.
Many-to-Many
Rows in both tables can be linked to many in the other.
Example: students and courses (through an enrollments table).
Self-Referencing
A table links to itself.
Example: employees with a manager_id.
Understanding these is easier once you see them visually. Especially when using an ER diagram to map connections between tables.
Common Design Pitfalls:
Missing foreign keys: Tables reference each other in theory, but without actual constraints in the schema, data gets out of sync.
Circular relationships: Tables depend on each other in a way that makes inserts/updates difficult without complex workarounds.
Overuse of many-to-many: Adding join tables everywhere without clear purpose can make queries unnecessarily complex.
Duplicate or inconsistent keys: Using different key formats or data types for related columns leads to broken joins.
Orphan records: Rows in child tables with no valid parent due to poor constraint enforcement.
How to Avoid These Pitfalls:
Always define foreign keys and enforce constraints in the schema.
Review relationship designs early to eliminate circular dependencies.
Use many-to-many relationships sparingly, and only when truly needed.
Standardize key naming, data types, and formats across related tables.
Regularly run integrity checks to detect and remove orphan records.
If you want to go deeper into structural schema problems beyond relationships, check out our guide on common database design mistakes.
Where You'll See This in Real Life
E-commerce: Customers place orders, orders contain products, and products belong to categories. Relationships keep inventory, checkout, and order history accurate without duplicating data.
Healthcare: Patients connect to doctors through appointments. One visit can link medical records, prescriptions, and billing, which is only possible when tables relate cleanly.
SaaS: Teams include users, users create tasks, and permissions control what each person can access. Good relationships make collaboration features scale without messy data structures.
Finance: Accounts hold transactions, transactions roll into portfolios, and reports depend on these links staying consistent and traceable.
Every serious app runs on relationships behind the scenes. When they’re structured properly, queries stay simple and systems scale smoothly. In relational systems, these connections maintain consistency across data, ensuring each relation in the database stays properly linked.
How to Work With Relationships in ChartDB
We built ChartDB so you can go from confusion to clarity in seconds. Below is a small video walkthrough of how you can use it.
Step 1: Import your schema
Run our one-line SQL query and paste the result into ChartDB.
Step 2: See your diagram
ChartDB automatically draws lines between tables using your foreign keys.
Step 3: Edit or add relationships
Each DB relationship you create is reflected instantly in the visual diagram.
If you want a step-by-step check out how to create relationships using foreign keys.
Step 4: Clean things up
Group related tables into areas, reposition them, and add notes. You can also explore ChartDB’s free SQL tools if you want to experiment further with schemas and relationships.
Why This Is Worth It
Good relationships mean:
Fewer bugs
Easier queries
Better collaboration
Clean and clear data
I built ChartDB because I kept encountering messy schemas that took hours to comprehend. I wanted a way to make sense of everything quickly, without digging through endless SQL or outdated docs.
If that sounds familiar, try it out here 👉 https://app.chartdb.io
It’s free to use, and it might just save your team a lot of time.
Additional Resources

Continue Reading


© 2026 ChartDB
Product
Free Tools
© 2025 ChartDB
Product
Free Tools
© 2025 ChartDB