
Apr 14, 2026
Draw.io vs Lucidchart vs ChartDB: Guide for Best ERD Tool
Draw.io vs Lucidchart vs ChartDB: Guide for Best ERD Tool
Draw.io vs Lucidchart vs ChartDB: Guide for Best ERD Tool
Comparing Draw.io, Lucidchart, and ChartDB for database diagrams? Here's an honest, hands-on breakdown of all three, tested with the same ERD.
Comparing Draw.io, Lucidchart, and ChartDB for database diagrams? Here's an honest, hands-on breakdown of all three, tested with the same ERD.
Comparing Draw.io, Lucidchart, and ChartDB for database diagrams? Here's an honest, hands-on breakdown of all three, tested with the same ERD.

Jonathan Fishner
5 minutes read
TLDR;
TLDR;
• What this covers: A hands-on comparison of Draw.io, Lucidchart, and ChartDB for creating database diagrams, tested with the same ERD across all three tools.
• Draw.io: Free, open-source, and great for general diagramming. No schema import or real-time collaboration, but covers the basics at zero cost.
• Lucidchart: Best for cross-functional enterprise teams that need real-time collaboration, integrations, and security certifications. Less suited for solo devs or database-specific work.
• ChartDB: Purpose-built for database schemas. Paste a single query result to generate a full ERD, with AI-powered DDL export for cross-database migrations and self-hosting via Docker.
You know that feeling when you join a new project and ask, "Okay, so how does the database actually work?", and someone sends you a 2-year-old screenshot that bears zero resemblance to the current schema?
The data visualization tools market is projected to grow from $5.9 billion to $10.2 billion by 2026. Undocumented schemas sit at the heart of that problem. And most teams still don't have the right tool to fix it.
If you’re here, you probably came across three of the most commonly compared options teams use for creating and organizing database diagrams. They are meant to solve and do almost the same things, but they are different in terms of features, pricing, and more. So you need to pick the one that works for your budget and project.
To help you do that, I'm Jonathan, co-founder of Chartdb. I have tested all three tools. One is mine, of course I know a little more about them.
Plus, having been in your shoes, I totally get the challenges you're facing, which is why I created Chartdb. In this comparison guide, you’ll get an honest evaluation based on real testing and knowledge.
Let’s get into it.
How I Evaluated These Tools
I've evaluated based on what users actually care about. Here are the questions you should ask before choosing the right ERD tool.
How fast can you get a real diagram, not just a blank canvas?
Are these tools for the same thing or different things?
Which database does it actually support?
Can it handle a big database?
Are you working with your schema, or redrawing it from scratch?
Can you share a diagram with someone who doesn't have an account?
Does the AI actually help with schema work, or just generate visuals?
Can your whole team work on the same diagram at the same time?
Can you export the SQL back, or at least save it as an image?
Does it connect with tools you already use, like Slack or GitHub?
Is your data stored safely, and do you get to choose where?
What are the Pricing details?
If something breaks, is there actually someone there to help you?
Draw.io | Lucidchart | ChartDB | |
Type | Open-source, general diagramming | Commercial, cloud-based, general diagramming | Open-source, database schema diagramming |
Pricing | Free forever (individual). Confluence Cloud free up to 10 users | Free tier: 3 docs, 60 objects. Paid from $7.95/user/month | Free: 2 diagrams, 10 tables. Pro: $25/user/month. Team: $59/month for 3 users |
Diagram Types | Flowcharts, UML, ERD, network, mind maps, BPMN | Flowcharts, UML, ERD, BPMN, wireframes, org charts, network | Database ERDs only |
Real-time Collaboration | File-based (can lag) | Yes - live cursors, inline comments, version history | Yes - with auto-save and undo/redo |
Database Schema Import | No | No | Yes - Smart Query (paste result, get full ERD) |
AI Features | No | Generate diagrams from text/Mermaid | DDL export, cross-database migration, schema-aware ERDs |
Offline Support | Yes - desktop apps for all OS | No | No |
Self-hosting | Yes | No | Yes - via Docker |
Integrations | Confluence, Jira, Notion, GitHub, Google Drive, OneDrive | Salesforce, GitHub, Slack, Jira, Confluence, Google Workspace, Microsoft Office | - |
Enterprise Security | - | SOC 2 Type II, ISO 27001, FedRAMP | - |
Best For | Solo devs, small teams, Atlassian orgs | Cross-functional enterprise teams | Developers and DBAs working with relational databases |
Skip If | Need low-latency real-time collab or live DB schema sync | Solo dev, or database documentation, is the primary need | Don't work with relational DBs or need general diagramming |
Draw.io (diagrams.net)
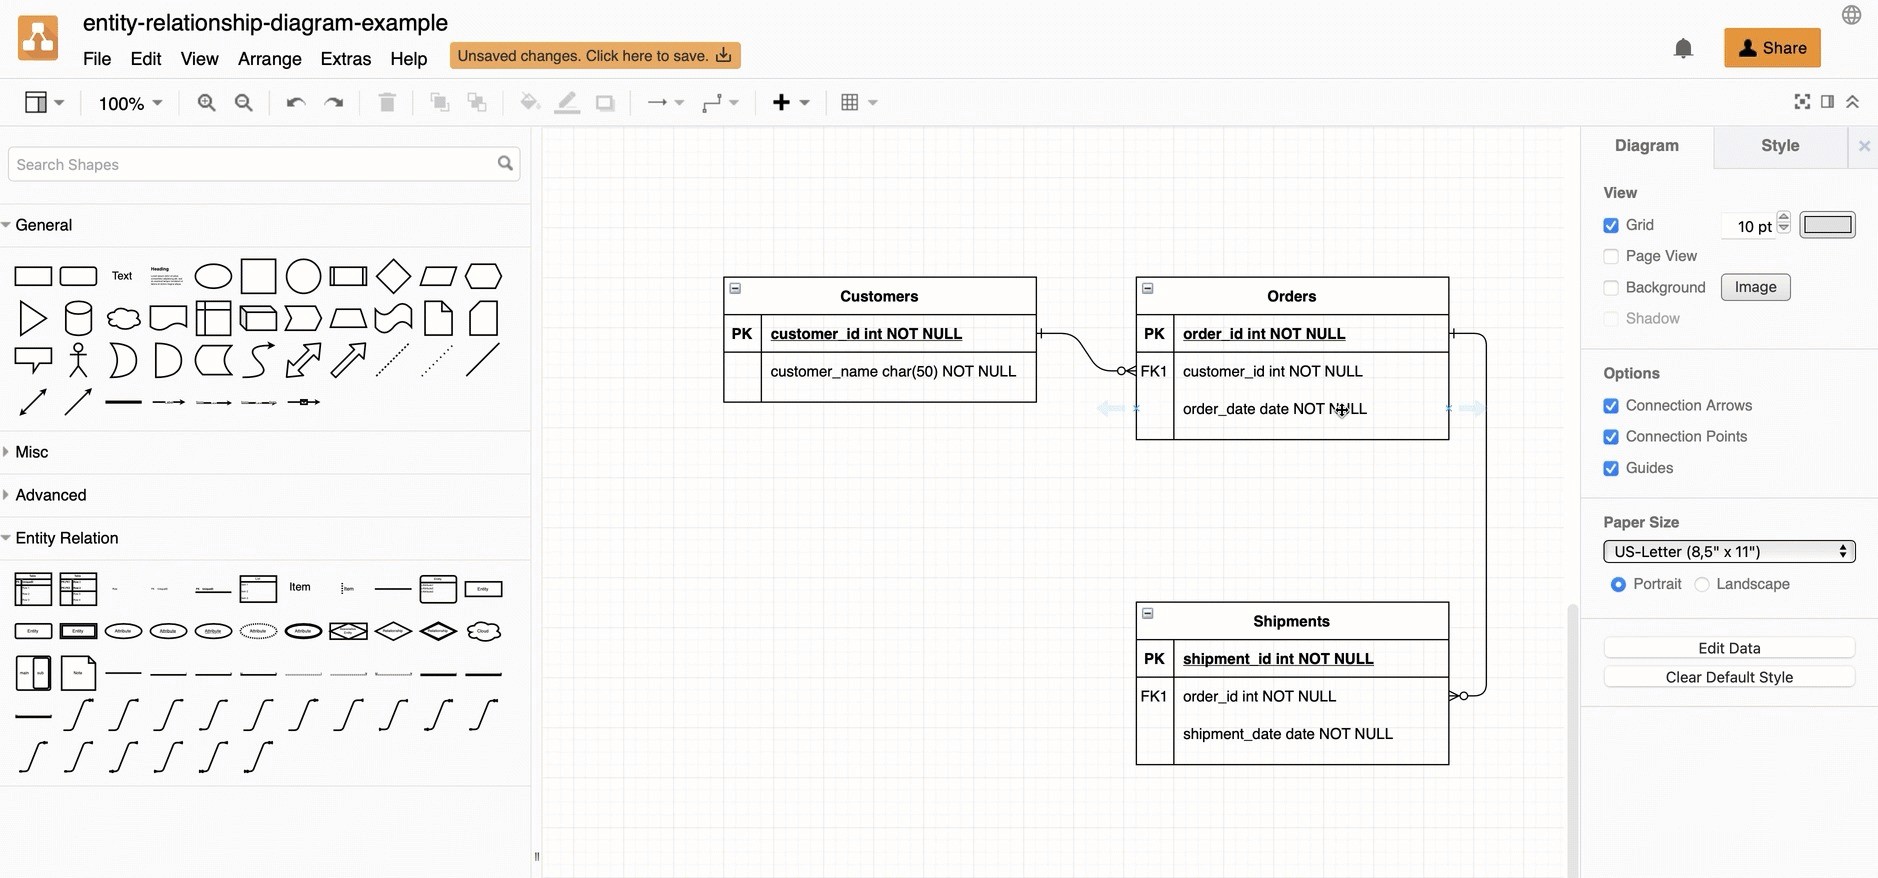
It is a VLC of diagramming. Free, open-source, and has been quietly excellent since the early 2000s. You don't need a subscription for individual use. Open the URL or desktop app, and you are good to go.
Key Features
Drag and drop for flowcharts, UML, ERDs, network diagrams, mind maps, BPMN
Desktop apps for Windows, macOS, Linux, and Chrome OS with full offline support
Save to Google Drive, OneDrive, Dropbox, GitHub, GitLab, Confluence or locally as XML
Export to SVG, PNG, JPEG, PDF, or embedded HTML.
Native plugin for Confluence, Jira, Notion, Nextcloud, and MediaWiki
Pricing
Teams can use draw.io in Atlassian Confluence Cloud for free up to 10 users. Beyond that, paid Standard and Advanced editions are available via the Atlassian Marketplace.
Pros and Cons
Every diagram type and export format at zero cost. No sign-up means you're diagramming within 10 seconds of landing on the page. You can export in pretty much every format you'd need, very handy if you're putting together docs.
Skip draw.io if you need smooth, low-latency real-time collaboration. It supports simultaneous editing via Google Drive, OneDrive, or Confluence Cloud, but syncing can lag because changes are file-based rather than server-pushed. Also, skip it if your main need is automatically pulling a live database schema into a diagram. There are ERD templates, but they are too generic to be of real use for database documentation work.
Best For
Solo developers, small teams, Atlassian-embedded organizations, and also if you don't mind drawing schemas manually. Draw.io covers quite a lot of what most developers need from a general diagramming tool, for free.
Lucidchart
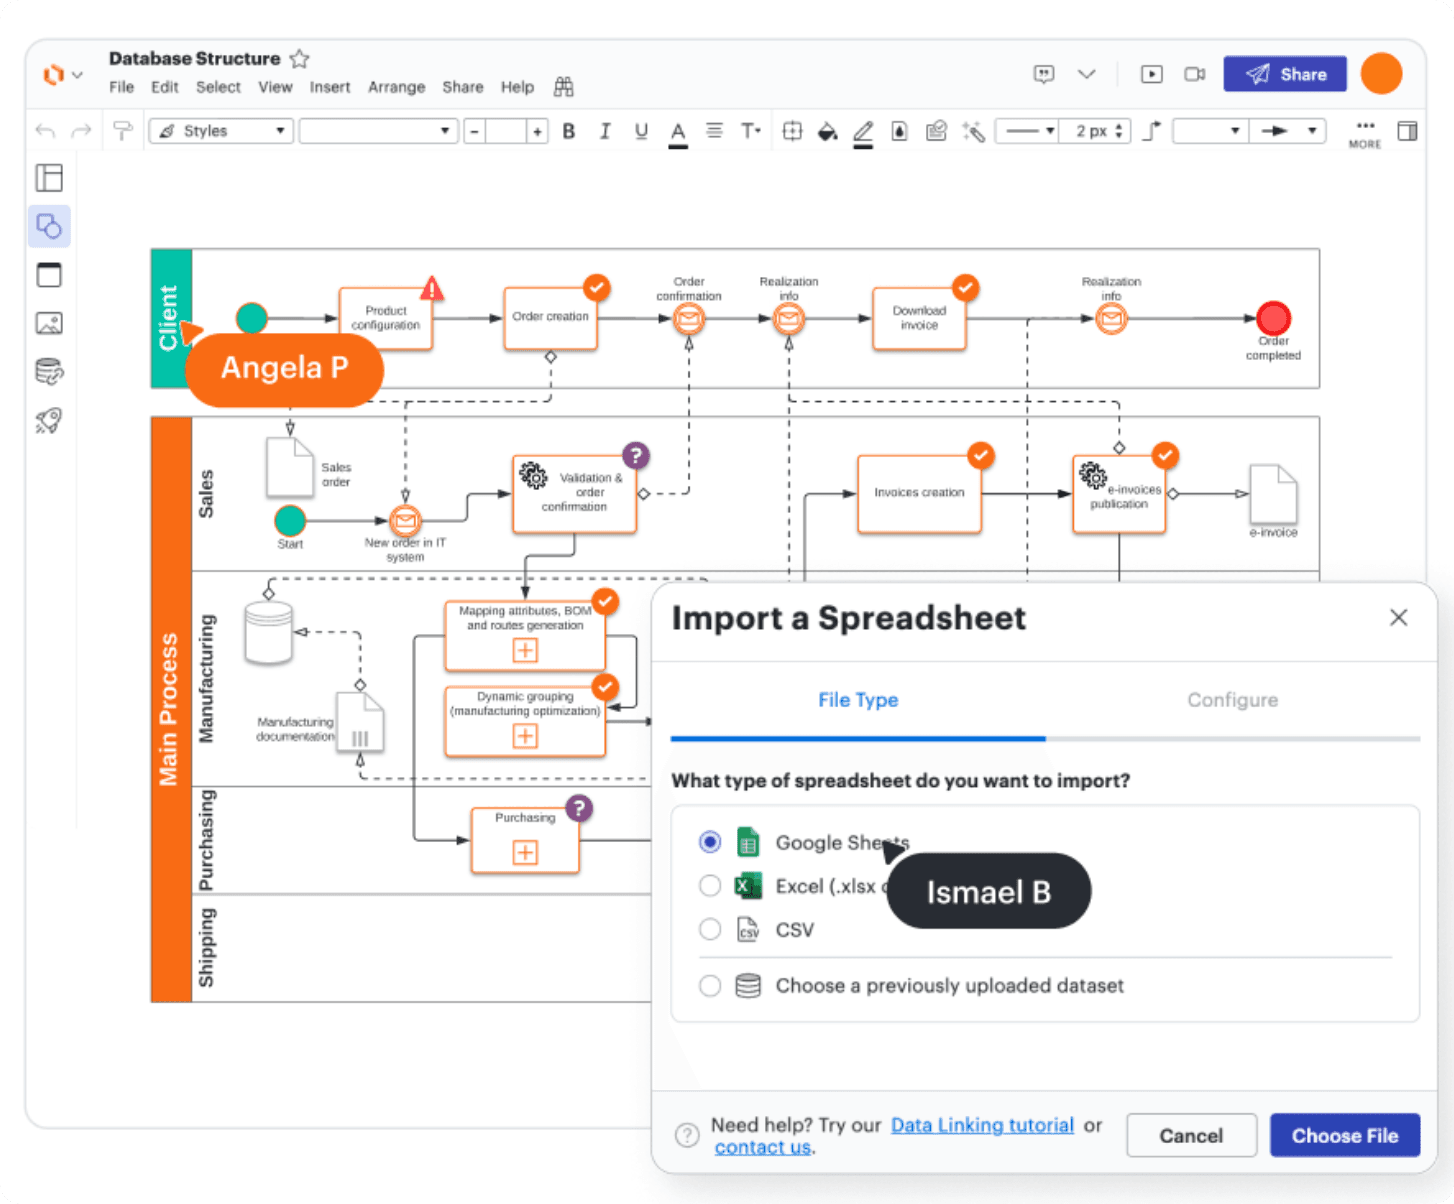
Commercial, cloud-based, built by Lucid Software in Utah. The default choice for a large share of enterprise teams, and it's earned that position through genuine product quality on the collaboration side.
Key Features
Drag-and-drop for flowcharts, UML, ERDs, BPMN, wireframes, org charts, and network diagrams
Real-time co-editing with live cursors, inline comments, and version history
AI diagram assistant: generate from text prompts or Mermaid code
Integrations with Salesforce, GitHub, Slack, Jira, Confluence, Google Workspace, Microsoft Office, and many more
Enterprise security: SOC 2 Type II, ISO 27001, FedRAMP Authorized
Pricing
The free tier offers 3 documents and 60 objects per diagram. Barely enough to evaluate it. Individual paid plans start at $7.95/user/month, billed annually. Team plans run $9/user/month. Enterprise is custom and required for SSO and SCIM.
Pros and Cons
Real-time collaboration is where Lucidchart genuinely earns its cost. The template library is enormous and well-organized. Integrations with Salesforce and GitHub actually surface useful data. Enterprise security certifications matter in regulated industries.
The cons are predictable. The free tier is deliberately painful, designed to push you to upgrade. Upgrade prompts interrupt mid-project. Complex diagrams lag when multiple concurrent editors are present. While the platform offers strong cloud-based capabilities, some users have noted that cancellation workflows could be streamlined and that offline access isn’t available.
Skip Lucidchart if you're a solo developer who diagrams occasionally. Also, skip it if database schema documentation is your primary need, ChartDB exists for that.
Best For
Cross-functional teams where non-technical stakeholders need to actively view and edit diagrams in real time. Organizations require enterprise security certifications. Teams already deep in the Google or Microsoft ecosystem.
ChartDB
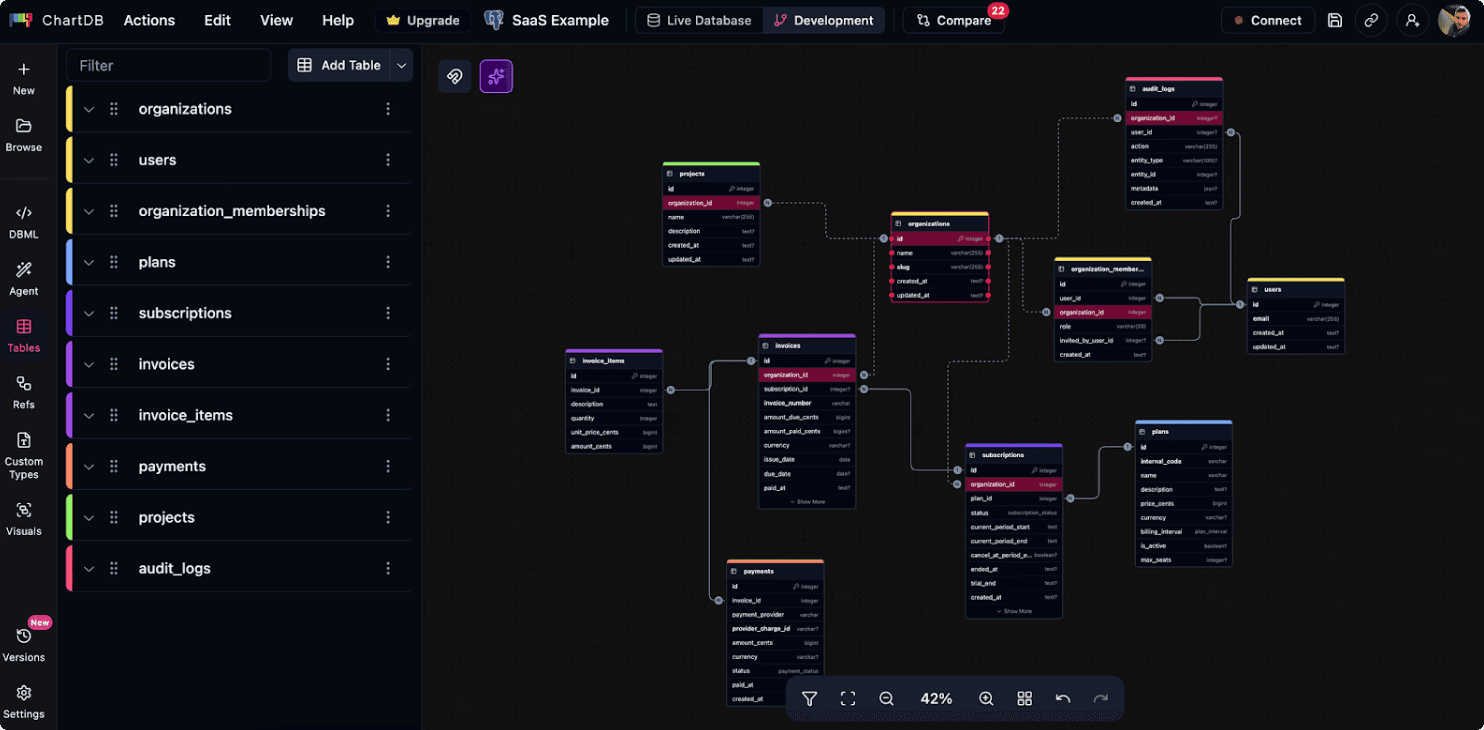
ChartDB is an open-source database diagramming tool designed to help you visualize and edit database schemas.
My co-founder, Guy Ben-Aharon, and I built ChartDB because we were tired of dealing with messy, hard-to-understand schemas and tools that slow you down rather than help.
We launched it in August 2024, and when we shared it on Hacker News and GitHub, the response was insane. We hit the front page of Hacker News within days and crossed 21.7k GitHub stars, which clearly shows developers are loving it.
I have created a video walkthrough for designing a schema on ChartDB. To learn more, watch the video below 👇
Key Features
Instant schema import via Smart Query for all major relational databases (PostgreSQL, MySQL, SQL Server, SQLite, MariaDB, CockroachDB)
AI powered DDL export that translates your schema between SQL dialects for cross-database migrations
DBML editor for text-based schema definition
Real-time collaboration with auto-save, undo/redo, and subject area grouping
Self-hosting via Docker for teams with strict data governance needs
AI that generates database aware ERDs, understands schema logic, and is built for real database workflows.
Pricing
Free forever plan that includes 2 diagrams, 10 tables each. Enough to test it, not enough for most production schemas. Paid plans: Pro at $25/user/month (unlimited diagrams, unlimited tables, DBML editor, version history), Team at $59/month for 3 users (real-time collaboration, AI assistant, live DB sync). Explore full pricing details from here.
Pros and Cons
The Smart Query import is the standout feature here. You run a single query in your own database client, paste the result into ChartDB, and your entire schema appears as a visual ERD without sharing any credentials or direct database connection. Neither of the other two tools offers anything like it.
The AI migration export works. PostgreSQL schema needing to run on MySQL? ChartDB generates the translated DDL. You review it first, but getting 95% there automatically saves real hours. ChartDB combines instant schema-to-diagram generation with AI that understands database structure.
Self-hosting is meaningful for regulated industries. The last thing you want is your database blueprint stored on a server you don't own.
The free tier is too tight for production work. ChartDB does nothing outside of database schema work. AGPL-3.0 license has implications for commercial teams considering self-hosting with modifications, so verify with legal before deploying.
Skip ChartDB if you don't work with relational databases or need a general diagramming tool for flowcharts, org charts, or wireframes.
Best For
Developers and DBAs documenting inherited schemas. Teams are onboarding new engineers. Anyone planning a cross-database migration. Organizations with data governance requirements prevent schema data from leaving the network.
Final Verdict
Now you already have enough context to make the call.
If you just need a general diagramming tool, draw.io does the job. It’s free, works offline, integrates well with tools like Confluence, and for most basic use cases, that’s all you need.
If your team includes non-technical folks who need to jump in, edit, and collaborate in real time, Lucidchart starts to make sense. The collaboration feels natural, the integrations are solid, and for larger teams, those enterprise features actually matter.
But if you work with databases day in, day out, the decision gets simpler.
ChartDB is built for schema work. Not diagrams where you manually drag ERD shapes around. Actual database schemas. You run a query, paste the output, and your full schema appears. Tables, database relationships, column types, everything.
And when you need to migrate across databases, it helps there too. Write in PostgreSQL, convert to MySQL, review the generated DDL, and move forward without wasting hours rewriting things.
Start creating with ChartDB, and you’ll know pretty quickly if it’s the right fit.
Additional Resources
If you found this useful, here are a few more pieces I've written that would be worth reading.
You know that feeling when you join a new project and ask, "Okay, so how does the database actually work?", and someone sends you a 2-year-old screenshot that bears zero resemblance to the current schema?
The data visualization tools market is projected to grow from $5.9 billion to $10.2 billion by 2026. Undocumented schemas sit at the heart of that problem. And most teams still don't have the right tool to fix it.
If you’re here, you probably came across three of the most commonly compared options teams use for creating and organizing database diagrams. They are meant to solve and do almost the same things, but they are different in terms of features, pricing, and more. So you need to pick the one that works for your budget and project.
To help you do that, I'm Jonathan, co-founder of Chartdb. I have tested all three tools. One is mine, of course I know a little more about them.
Plus, having been in your shoes, I totally get the challenges you're facing, which is why I created Chartdb. In this comparison guide, you’ll get an honest evaluation based on real testing and knowledge.
Let’s get into it.
How I Evaluated These Tools
I've evaluated based on what users actually care about. Here are the questions you should ask before choosing the right ERD tool.
How fast can you get a real diagram, not just a blank canvas?
Are these tools for the same thing or different things?
Which database does it actually support?
Can it handle a big database?
Are you working with your schema, or redrawing it from scratch?
Can you share a diagram with someone who doesn't have an account?
Does the AI actually help with schema work, or just generate visuals?
Can your whole team work on the same diagram at the same time?
Can you export the SQL back, or at least save it as an image?
Does it connect with tools you already use, like Slack or GitHub?
Is your data stored safely, and do you get to choose where?
What are the Pricing details?
If something breaks, is there actually someone there to help you?
Draw.io | Lucidchart | ChartDB | |
Type | Open-source, general diagramming | Commercial, cloud-based, general diagramming | Open-source, database schema diagramming |
Pricing | Free forever (individual). Confluence Cloud free up to 10 users | Free tier: 3 docs, 60 objects. Paid from $7.95/user/month | Free: 2 diagrams, 10 tables. Pro: $25/user/month. Team: $59/month for 3 users |
Diagram Types | Flowcharts, UML, ERD, network, mind maps, BPMN | Flowcharts, UML, ERD, BPMN, wireframes, org charts, network | Database ERDs only |
Real-time Collaboration | File-based (can lag) | Yes - live cursors, inline comments, version history | Yes - with auto-save and undo/redo |
Database Schema Import | No | No | Yes - Smart Query (paste result, get full ERD) |
AI Features | No | Generate diagrams from text/Mermaid | DDL export, cross-database migration, schema-aware ERDs |
Offline Support | Yes - desktop apps for all OS | No | No |
Self-hosting | Yes | No | Yes - via Docker |
Integrations | Confluence, Jira, Notion, GitHub, Google Drive, OneDrive | Salesforce, GitHub, Slack, Jira, Confluence, Google Workspace, Microsoft Office | - |
Enterprise Security | - | SOC 2 Type II, ISO 27001, FedRAMP | - |
Best For | Solo devs, small teams, Atlassian orgs | Cross-functional enterprise teams | Developers and DBAs working with relational databases |
Skip If | Need low-latency real-time collab or live DB schema sync | Solo dev, or database documentation, is the primary need | Don't work with relational DBs or need general diagramming |
Draw.io (diagrams.net)
It is a VLC of diagramming. Free, open-source, and has been quietly excellent since the early 2000s. You don't need a subscription for individual use. Open the URL or desktop app, and you are good to go.
Key Features
Drag and drop for flowcharts, UML, ERDs, network diagrams, mind maps, BPMN
Desktop apps for Windows, macOS, Linux, and Chrome OS with full offline support
Save to Google Drive, OneDrive, Dropbox, GitHub, GitLab, Confluence or locally as XML
Export to SVG, PNG, JPEG, PDF, or embedded HTML.
Native plugin for Confluence, Jira, Notion, Nextcloud, and MediaWiki
Pricing
Teams can use draw.io in Atlassian Confluence Cloud for free up to 10 users. Beyond that, paid Standard and Advanced editions are available via the Atlassian Marketplace.
Pros and Cons
Every diagram type and export format at zero cost. No sign-up means you're diagramming within 10 seconds of landing on the page. You can export in pretty much every format you'd need, very handy if you're putting together docs.
Skip draw.io if you need smooth, low-latency real-time collaboration. It supports simultaneous editing via Google Drive, OneDrive, or Confluence Cloud, but syncing can lag because changes are file-based rather than server-pushed. Also, skip it if your main need is automatically pulling a live database schema into a diagram. There are ERD templates, but they are too generic to be of real use for database documentation work.
Best For
Solo developers, small teams, Atlassian-embedded organizations, and also if you don't mind drawing schemas manually. Draw.io covers quite a lot of what most developers need from a general diagramming tool, for free.
Lucidchart
Commercial, cloud-based, built by Lucid Software in Utah. The default choice for a large share of enterprise teams, and it's earned that position through genuine product quality on the collaboration side.
Key Features
Drag-and-drop for flowcharts, UML, ERDs, BPMN, wireframes, org charts, and network diagrams
Real-time co-editing with live cursors, inline comments, and version history
AI diagram assistant: generate from text prompts or Mermaid code
Integrations with Salesforce, GitHub, Slack, Jira, Confluence, Google Workspace, Microsoft Office, and many more
Enterprise security: SOC 2 Type II, ISO 27001, FedRAMP Authorized
Pricing
The free tier offers 3 documents and 60 objects per diagram. Barely enough to evaluate it. Individual paid plans start at $7.95/user/month, billed annually. Team plans run $9/user/month. Enterprise is custom and required for SSO and SCIM.
Pros and Cons
Real-time collaboration is where Lucidchart genuinely earns its cost. The template library is enormous and well-organized. Integrations with Salesforce and GitHub actually surface useful data. Enterprise security certifications matter in regulated industries.
The cons are predictable. The free tier is deliberately painful, designed to push you to upgrade. Upgrade prompts interrupt mid-project. Complex diagrams lag when multiple concurrent editors are present. While the platform offers strong cloud-based capabilities, some users have noted that cancellation workflows could be streamlined and that offline access isn’t available.
Skip Lucidchart if you're a solo developer who diagrams occasionally. Also, skip it if database schema documentation is your primary need, ChartDB exists for that.
Best For
Cross-functional teams where non-technical stakeholders need to actively view and edit diagrams in real time. Organizations require enterprise security certifications. Teams already deep in the Google or Microsoft ecosystem.
ChartDB
ChartDB is an open-source database diagramming tool designed to help you visualize and edit database schemas.
My co-founder, Guy Ben-Aharon, and I built ChartDB because we were tired of dealing with messy, hard-to-understand schemas and tools that slow you down rather than help.
We launched it in August 2024, and when we shared it on Hacker News and GitHub, the response was insane. We hit the front page of Hacker News within days and crossed 21.7k GitHub stars, which clearly shows developers are loving it.
I have created a video walkthrough for designing a schema on ChartDB. To learn more, watch the video below 👇
Key Features
Instant schema import via Smart Query for all major relational databases (PostgreSQL, MySQL, SQL Server, SQLite, MariaDB, CockroachDB)
AI powered DDL export that translates your schema between SQL dialects for cross-database migrations
DBML editor for text-based schema definition
Real-time collaboration with auto-save, undo/redo, and subject area grouping
Self-hosting via Docker for teams with strict data governance needs
AI that generates database aware ERDs, understands schema logic, and is built for real database workflows.
Pricing
Free forever plan that includes 2 diagrams, 10 tables each. Enough to test it, not enough for most production schemas. Paid plans: Pro at $25/user/month (unlimited diagrams, unlimited tables, DBML editor, version history), Team at $59/month for 3 users (real-time collaboration, AI assistant, live DB sync). Explore full pricing details from here.
Pros and Cons
The Smart Query import is the standout feature here. You run a single query in your own database client, paste the result into ChartDB, and your entire schema appears as a visual ERD without sharing any credentials or direct database connection. Neither of the other two tools offers anything like it.
The AI migration export works. PostgreSQL schema needing to run on MySQL? ChartDB generates the translated DDL. You review it first, but getting 95% there automatically saves real hours. ChartDB combines instant schema-to-diagram generation with AI that understands database structure.
Self-hosting is meaningful for regulated industries. The last thing you want is your database blueprint stored on a server you don't own.
The free tier is too tight for production work. ChartDB does nothing outside of database schema work. AGPL-3.0 license has implications for commercial teams considering self-hosting with modifications, so verify with legal before deploying.
Skip ChartDB if you don't work with relational databases or need a general diagramming tool for flowcharts, org charts, or wireframes.
Best For
Developers and DBAs documenting inherited schemas. Teams are onboarding new engineers. Anyone planning a cross-database migration. Organizations with data governance requirements prevent schema data from leaving the network.
Final Verdict
Now you already have enough context to make the call.
If you just need a general diagramming tool, draw.io does the job. It’s free, works offline, integrates well with tools like Confluence, and for most basic use cases, that’s all you need.
If your team includes non-technical folks who need to jump in, edit, and collaborate in real time, Lucidchart starts to make sense. The collaboration feels natural, the integrations are solid, and for larger teams, those enterprise features actually matter.
But if you work with databases day in, day out, the decision gets simpler.
ChartDB is built for schema work. Not diagrams where you manually drag ERD shapes around. Actual database schemas. You run a query, paste the output, and your full schema appears. Tables, database relationships, column types, everything.
And when you need to migrate across databases, it helps there too. Write in PostgreSQL, convert to MySQL, review the generated DDL, and move forward without wasting hours rewriting things.
Start creating with ChartDB, and you’ll know pretty quickly if it’s the right fit.
Additional Resources
If you found this useful, here are a few more pieces I've written that would be worth reading.

Continue Reading


© 2026 ChartDB
Product
Free Tools
© 2025 ChartDB
Product
Free Tools
© 2025 ChartDB