
Dec 17, 2025
Dbdiagram vs Draw.io vs ChartDB: A Complete Comparison for Data Teams
Dbdiagram vs Draw.io vs ChartDB: A Complete Comparison for Data Teams
Dbdiagram vs Draw.io vs ChartDB: A Complete Comparison for Data Teams
Compare dbdiagram, Draw.io, and ChartDB for ERD creation and database visualization. Learn which tool is best for your team in 2026 and why.
Compare dbdiagram, Draw.io, and ChartDB for ERD creation and database visualization. Learn which tool is best for your team in 2026 and why.
Compare dbdiagram, Draw.io, and ChartDB for ERD creation and database visualization. Learn which tool is best for your team in 2026 and why.

Jonathan Fishner
9 minutes read
TLDR;
TLDR;
• What this covers: A hands-on comparison of dbdiagram, Draw.io, and ChartDB, tested by building the same schema in all three tools.
• dbdiagram: Text-first approach using DBML syntax. Good for developers who prefer code over drag-and-drop, but limited in AI and collaboration.
• Draw.io: Free general-purpose diagramming tool. Great for quick sketches, but no database import or schema-aware features.
• ChartDB: Built specifically for database schemas with Smart Query import, AI-powered DDL export, and real-time collaboration.
Introduction
If you work with databases long enough, you eventually end up in the same situation.
Someone asks a simple question like “Where does this field come from” and suddenly you are digging through SQL files, old wiki pages, and screenshots from three years ago.
Tools like dbdiagram, Draw.io, and ChartDB already exist to solve exactly that problem. They help you visualise your database schema, understand relationships, and communicate structure to the rest of the team.
Whether you are already using one of them and are thinking about a switch, or you are starting from scratch and comparing options, this guide will walk you through a clear, side by side breakdown.
Hi, I am Jonathan, founder of ChartDB. I have spent the last years building tools around database schemas and ER diagrams, and I have used all three of these tools in real work. This comparison is based on actual testing. I created the same simple demo schema in each one, clicked around, and paid attention to what felt smooth and what did not. You can include screenshots of those three diagrams in the final post to show that this was tested for real.
My goal here is to help you pick the right tool for your team, even if that choice is not ChartDB.
We have built this small comparison guide to pick you the right one for your team.
Let’s get started!!
How We Compare dbdiagram, Draw.io, and ChartDB
To keep this fair and practical, I looked at how each tool performs across a few important areas:
Import and sync from an existing database
Supported databases and formats
Collaboration and sharing
Export options
AI capabilities
Performance with larger schemas
Templates and examples
Integrations
Hosting and security
Pricing and limits
Customer support and product care
You can always add more criteria for your own use case. For most data teams, these are the ones that matter day to day.
dbdiagram
dbdiagram.io is a popular web based ERD tool built mainly for developers. Instead of dragging tables onto a canvas, you write a small DSL (domain specific language) or paste SQL, and dbdiagram generates the diagram for you.
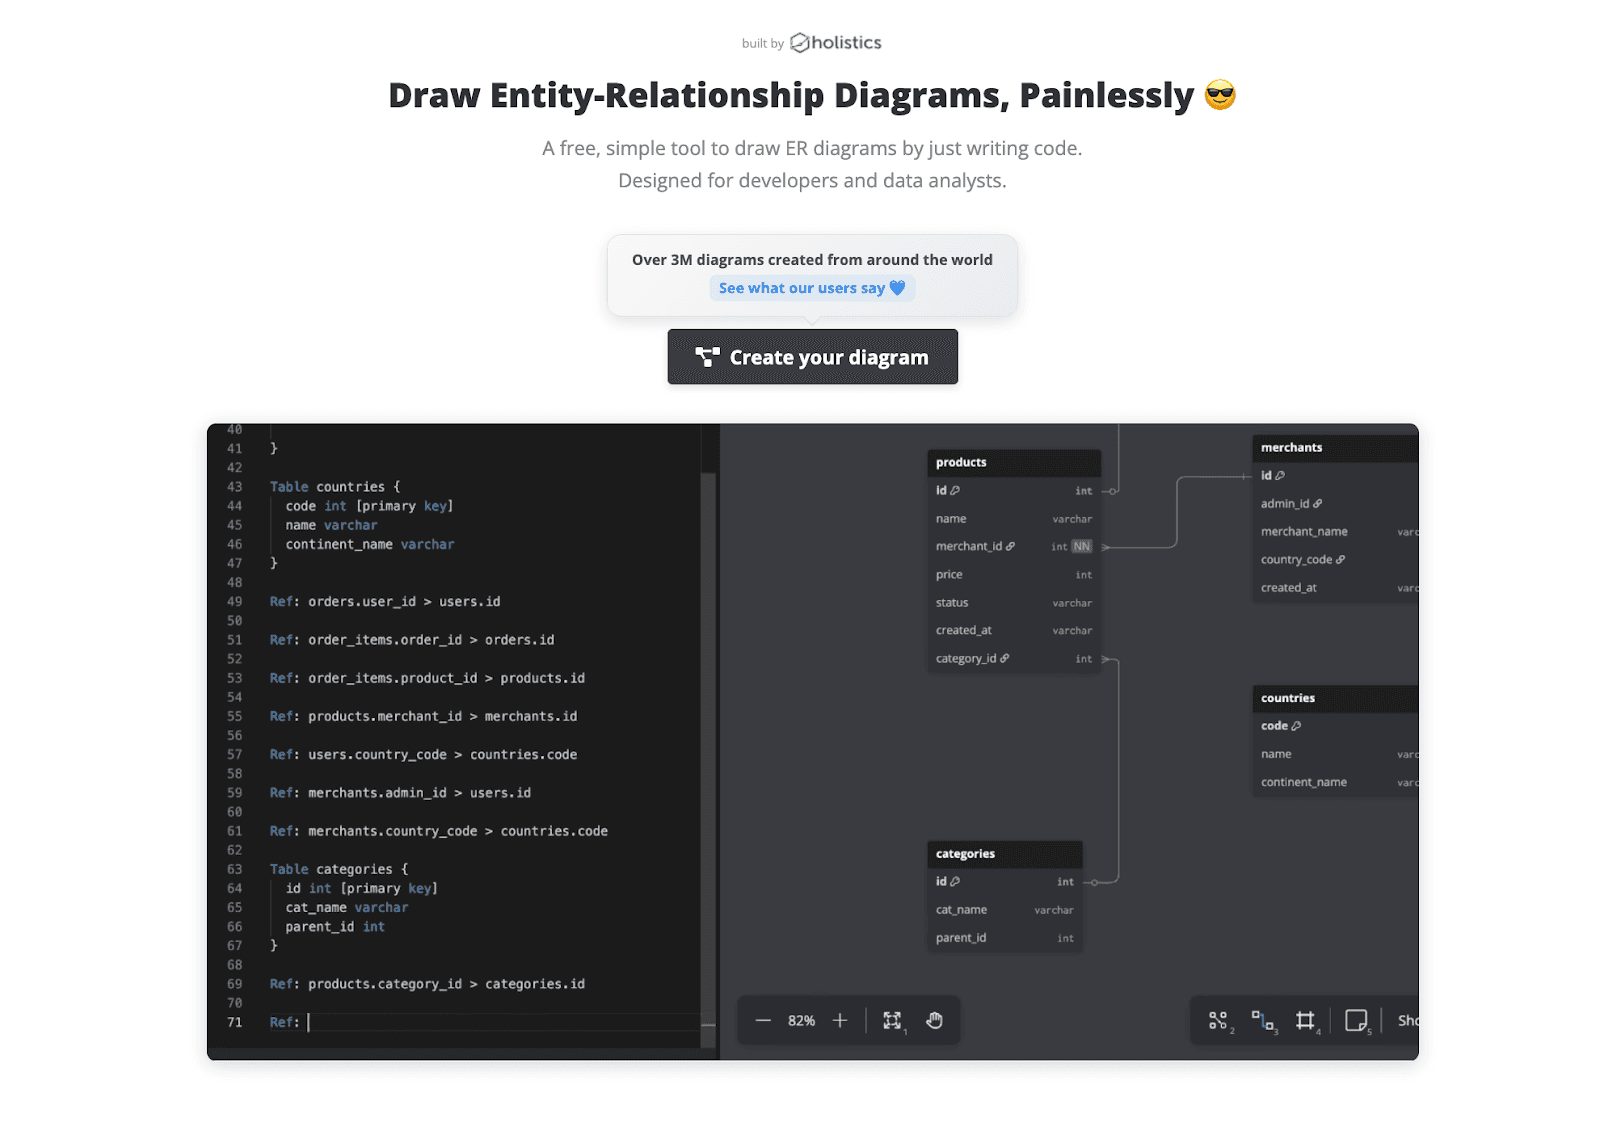
It is simple, fast, and great if you like to stay close to code. Many teams use it for quick sketches or sharing small schemas with others.
In my test, I built a small SaaS schema with users, teams, projects, and subscriptions. It took only a few minutes to write the DSL and get a clean diagram. This is where you can add a screenshot of that diagram.
Features and experience
Import and modeling
You can import from SQL or create schemas with their DSL. There is no live sync to a running database. It is more of a design and documentation tool than a schema management platform.
Supported databases
Supports multiple SQL dialects, and you can export SQL for engines like PostgreSQL, MySQL, and others. It does not focus on non relational or multi model databases.
Collaboration and sharing
You can share public links and invite collaborators. It is good enough for small teams that want to comment or tweak diagrams together, but it is not built as a full collaborative workspace.
Export options
You can export to SQL and images. That covers most basic needs for docs and reviews.
AI capabilities
Currently, dbdiagram is mostly manual or DSL based. It does not feel like an AI native tool. You are responsible for writing or importing the schema structure yourself.
Performance
For small to medium sized schemas it works well. When diagrams get very large, the simple canvas can start to feel crowded.
Templates and examples
Has some templates and examples, which help you get started, especially if you are new to ERDs.
Hosting and security
It is a hosted SaaS. If you need self hosting or strict on prem requirements, you may need another option for sensitive schemas.
Pricing
dbdiagram has a free plan that works nicely for individuals or very small teams with a limited number of diagrams. Paid plans add more diagrams, private projects, and collaboration features.
For most teams, the usual pattern is: start on the free plan, then upgrade once you want to store multiple schemas or invite more developers.
Check their official pricing page for up to date details.
Draw.io (diagrams.net)
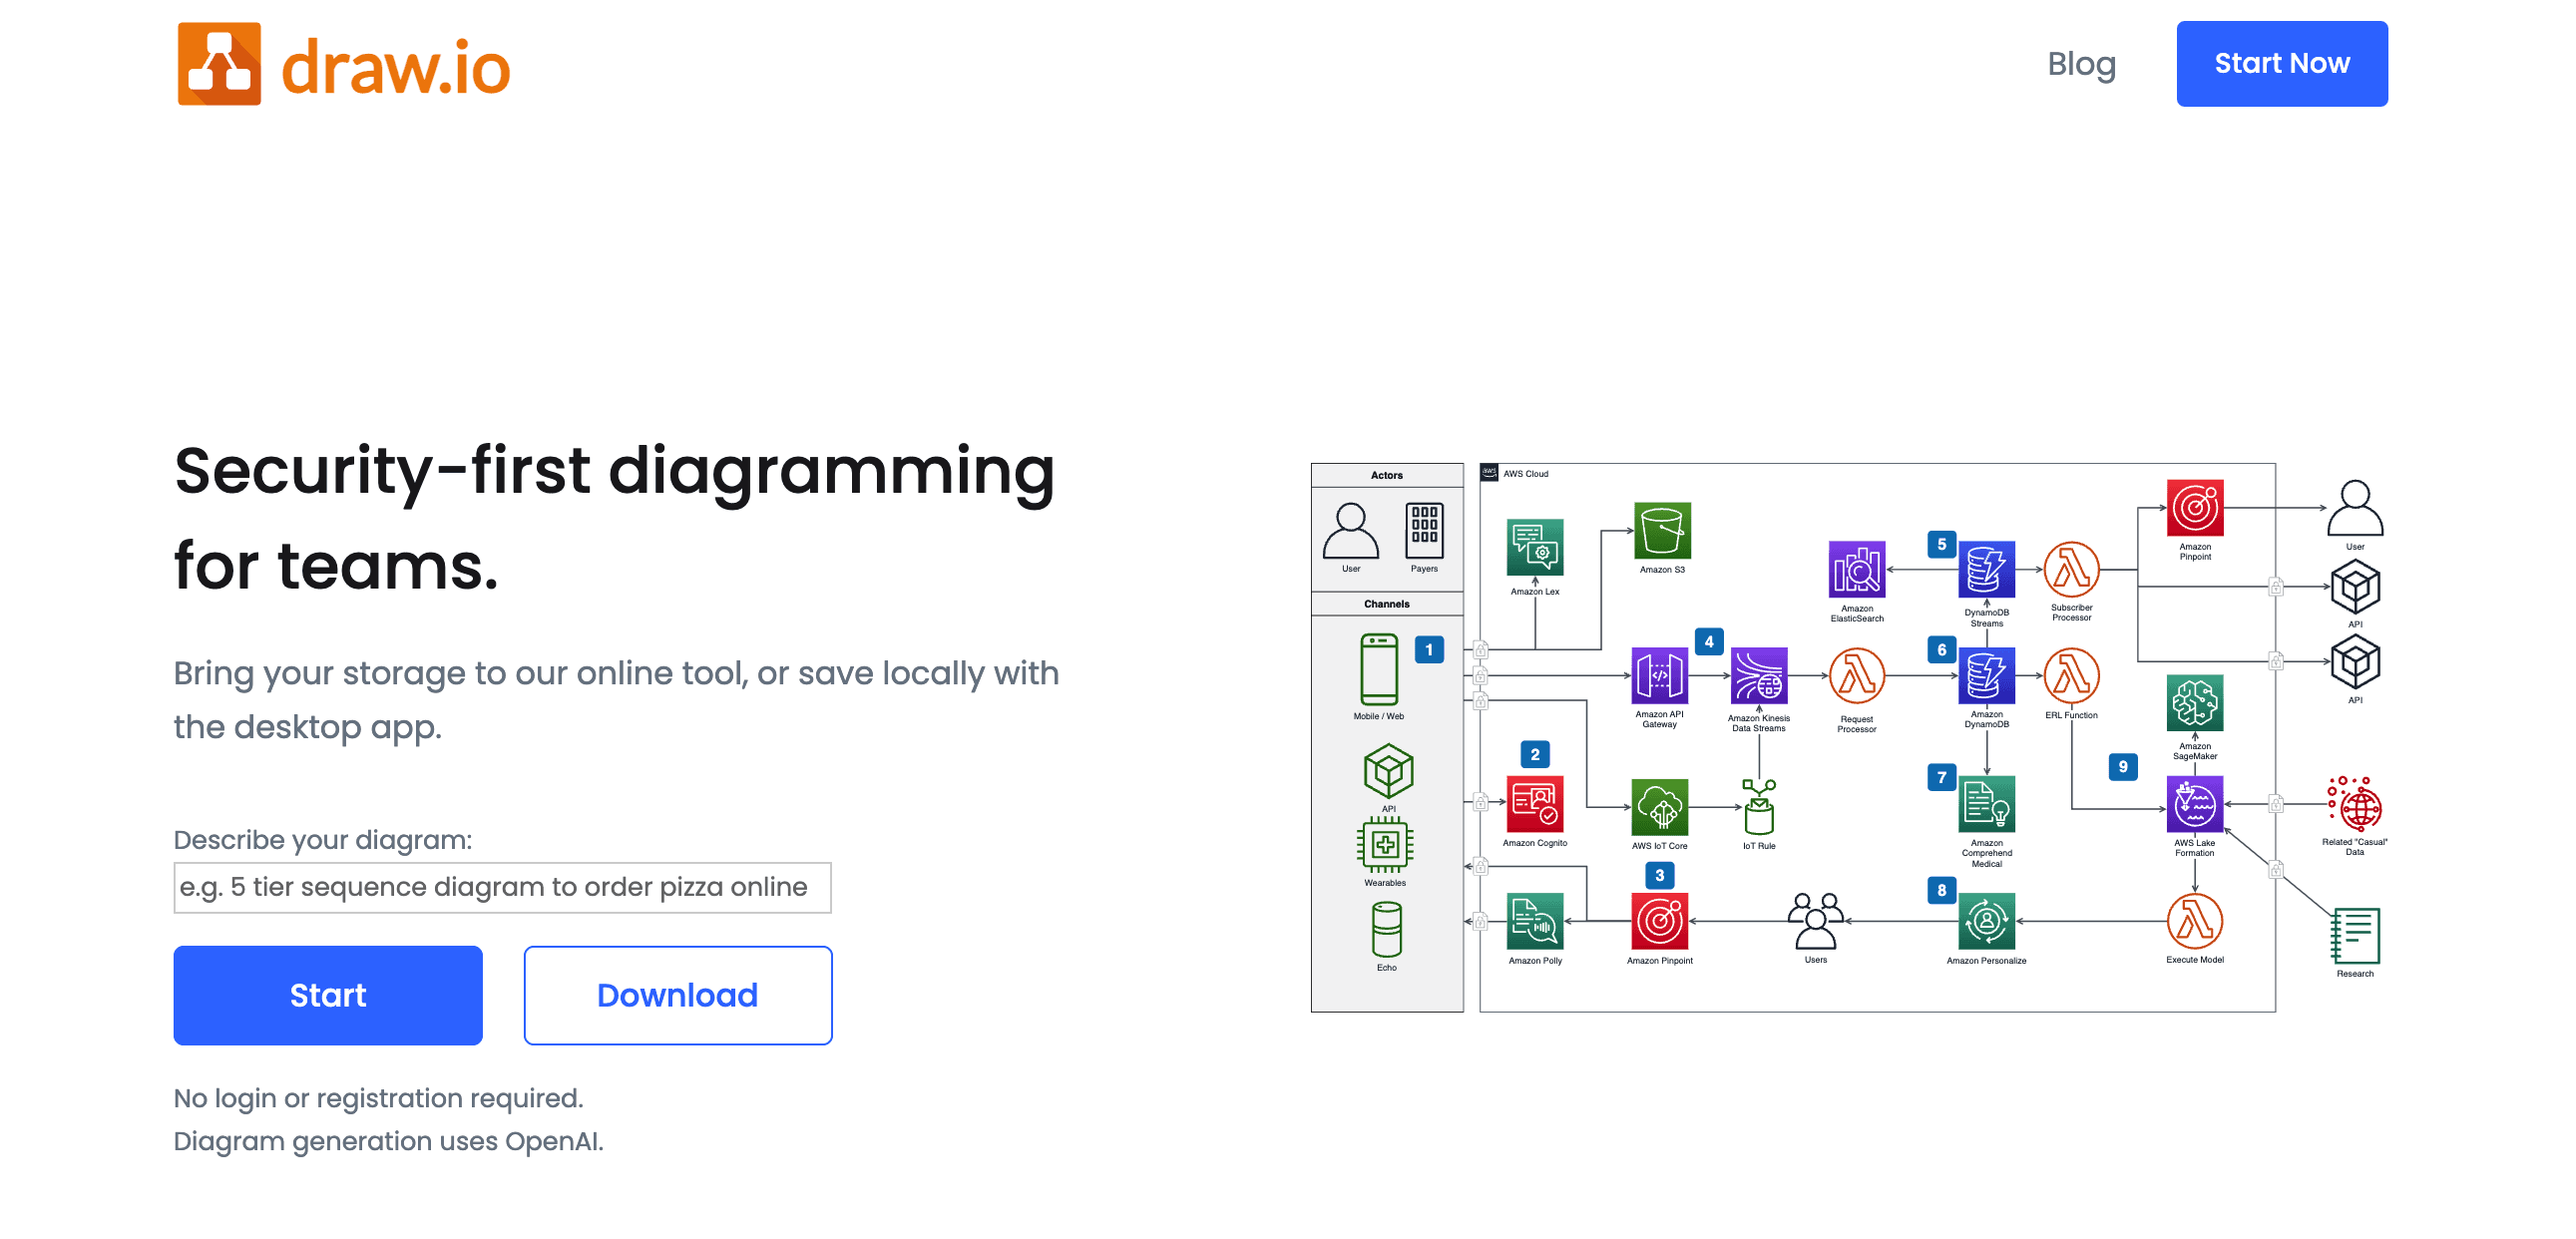
Draw.io (also known as diagrams.net) is a general purpose diagramming tool. People use it for flowcharts, architecture diagrams, mind maps, and yes, ERDs too. It is free, open source, and runs entirely in the browser or inside tools like Confluence.
Draw.io is not a database specific tool, but you can absolutely create ER diagrams with it if you are willing to draw everything manually.
For this comparison, I recreated the same SaaS schema in Draw.io. The result looked fine visually, but it took more manual work. This is where you can add the screenshot of that diagram.
Features and experience
Import and modeling
There is no native database import for schemas. You create tables by hand and connect them with lines. If you want more database awareness, you have to build your own shapes or templates.
Supported databases
Draw.io does not care about specific database engines. It treats everything as generic shapes. That is flexible, but it also means you get no database specific validation or automation.
Collaboration and sharing
You can store diagrams in Google Drive, OneDrive, Git, or inside Confluence. Collaboration depends on where you host the file. It works, but it is not focused on real time collaboration around database schemas.
Export options
Strong on exports. You can export to PNG, SVG, PDF, and more. This is great for documentation.
AI capabilities
Draw.io does not focus on AI generated ERDs. You draw things yourself. There may be small helpers or plugins, but it is not built as an AI first modeling tool.
Performance
Draw.io can handle quite large diagrams, but once you have many tables, it turns into a classic whiteboard problem. It is easy to lose structure when everything is just manual shapes.
Templates and examples
There are many diagram templates, including ERD shapes. They help, but they are generic.
Integrations
Excellent if your company already uses Atlassian tools. Integration with Confluence and Jira is a strong point. It also plays well with popular cloud drives.
Hosting and security
You can run Draw.io locally, inside your own infrastructure, or purely in the browser. This is a big plus if you want control over where data lives.
Pricing
The core tool is free and open source. You only pay if you use it as an add on with products like Confluence or Jira, where billing flows through those platforms.
If you want a general diagramming tool and do not mind drawing schemas by hand, Draw.io is very cost effective.
ChartDB
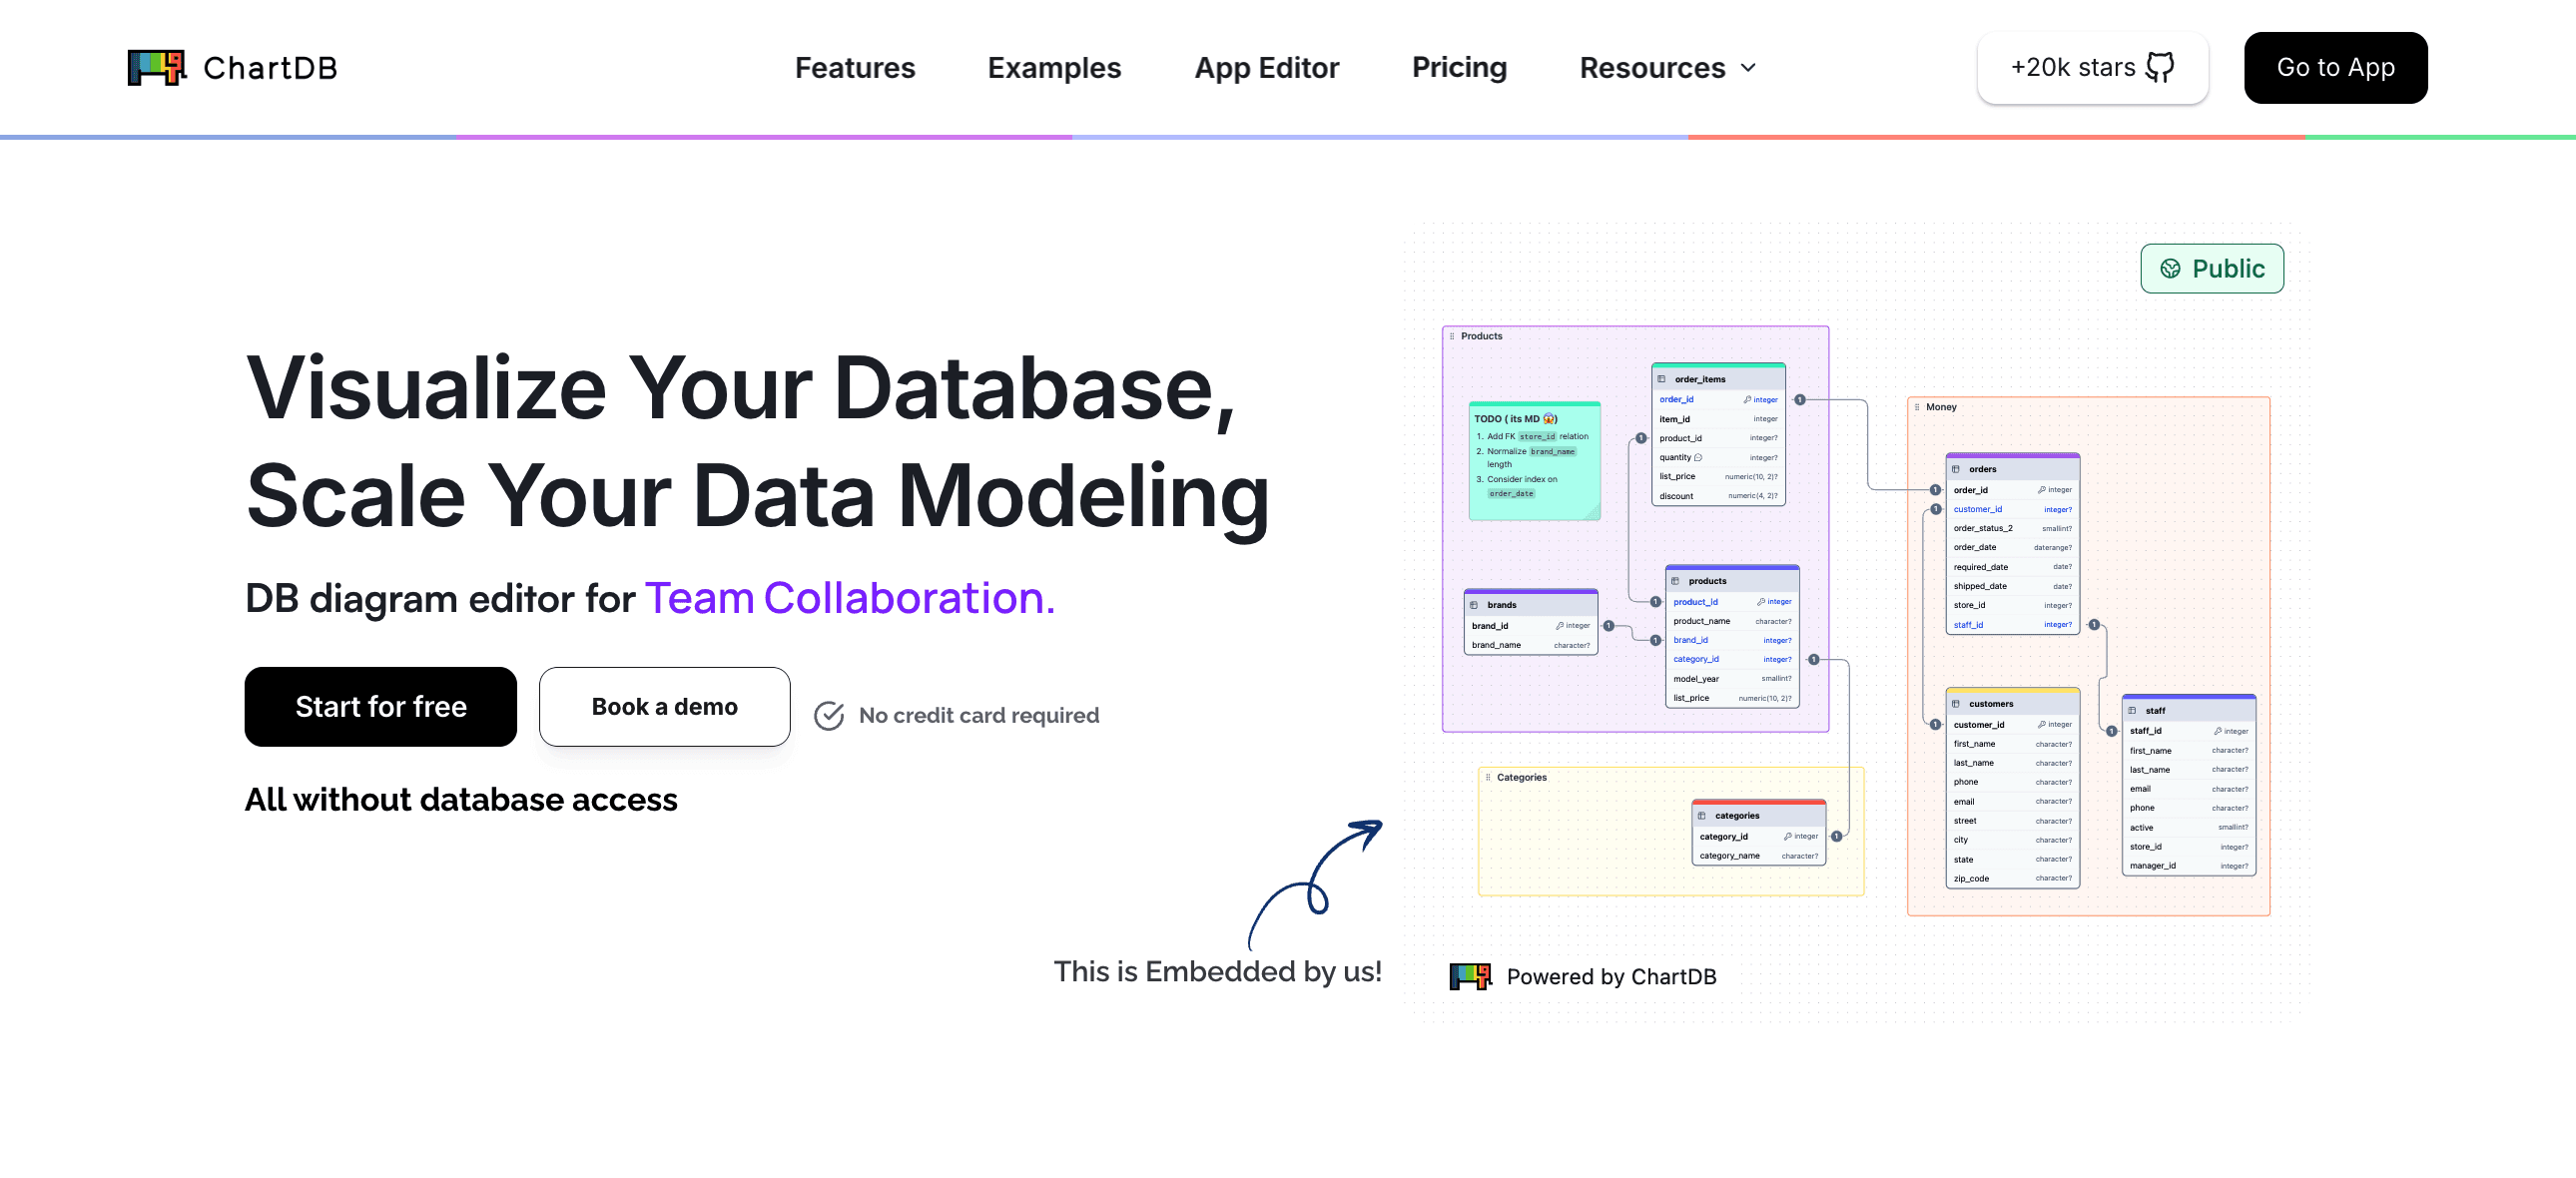
ChartDB is the tool I am building with my co-founder. It is a modern, AI native database visualization and ERD tool, created specifically for developers and data teams.
You can import a schema from SQL or a live database, generate diagrams from natural language, and then refine everything visually with strong AI support. It is designed to handle both small and large schemas without feeling heavy.
For this comparison, I created the same SaaS schema in ChartDB. The AI Agent generated the first version from a text prompt, and then I tweaked layout and colors. This is where you can include the screenshot of the ChartDB diagram.
Features and experience
Import and sync from existing databases
You can import schemas from SQL, DB dumps, or connect to databases like PostgreSQL, MySQL, SQL Server, SQLite, and others. ChartDB is built to feel “close to the metal” for actual databases, not just toy examples.
Supported databases
ChartDB focuses on relational databases and supports multiple dialects. You can also use it for logical modeling, even if you have not created the physical database yet.
AI capabilities
This is where ChartDB really stands out.
With the AI Agent you can:
Ask the AI to suggest foreign keys and fix missing relationships
Add timestamps, soft deletes, and other patterns across all tables
Refactor names, group tables by domain, and clean up legacy schemas
The idea is simple. Let AI remove the grunt work and let you focus on good design.
Editing, customization, and large schemas
The editor is built for real world work. You can:
Drag and drop tables
Color code by domain
Group tables into areas
Add notes and annotations
ChartDB is optimized for large schemas. You can zoom, filter by schema or area, and still stay oriented even when you have dozens or hundreds of tables.
Collaboration and sharing
You can invite teammates, share links, and work together on diagrams. ChartDB works well for reviews, architecture discussions, and onboarding sessions.
Export options
You can export diagrams to images or SQL. For many users, the flow is: design visually, then export DDL, then apply to the database.
Templates and examples
There are growing sets of templates, and the AI makes it easy to bootstrap a schema from a simple idea like “multi-tenant SaaS with billing, permissions, and audit logs”.
Integrations, hosting, and security
ChartDB is available as a cloud service. There is also an open source core, which is important if you care about self hosting or transparency.
Pricing
ChartDB has a free plan that is generous enough to try it on real schemas. Paid plans unlock more diagrams, AI usage, and team collaboration options.
Most small teams start with the free plan or a basic paid tier, then scale up as they move more projects into ChartDB and expand collaboration.
You can always check the pricing page on chartdb.io for the latest details.
Comparison Table
Feature | dbdiagram | Draw.io | ChartDB |
Primary focus | Code first ERDs | General purpose diagrams | Database visualization and ERDs for data teams |
Input methods | DBML, SQL | Manual drawing with shapes | SQL, live DB import, natural language prompts |
Import from existing DB | SQL or DBML only | No native DB import | Yes, from live databases and SQL dumps |
AI capabilities | None | None | AI agent for generating and editing schemas |
Collaboration | Basic sharing and team access | File based, works via Drive or Confluence | Built in sharing for reviews and team collaboration |
Performance on large ERDs | Good for small and medium diagrams | Can become crowded with many manual shapes | Optimized for large schemas with colors and areas |
Templates and examples | Some examples and community snippets | Many generic diagram templates | Templates plus AI generated starters |
Export options | SQL, DBML, images | PNG, SVG, PDF, and more | SQL in multiple dialects, images |
Embeds | Via exported images | Easy to embed files in docs and Confluence | Shareable links and embeds for live diagrams |
Hosting and security | Hosted SaaS only | Browser, desktop, or inside your own stack | Cloud app plus open source self hosted core |
Pricing entry point | Free plan with limits | Core app is free and open source | Free plan with paid tiers for teams and more AI usage |
Best suited for | Developers who like code based schema design | Teams that need many kinds of diagrams | Teams that want AI help and work with real world DBs |
Final Verdict: Which Tool Should You Use
Each of these tools has real strengths. The right choice depends on how you work and what you need.
dbdiagram is best if you love a code like workflow and want a fast, simple way to create ERDs from DSL or SQL. It shines for quick diagrams and developer centric teams that do not need heavy AI or live sync.
Draw.io is best if you want a general diagramming tool and only occasionally need to draw ERDs. It is flexible, free, and great for companies already deep into Confluence or generic diagrams, but it lacks database specific automation.
ChartDB is best if you want an AI powered database visualization tool that handles real world schemas, helps you refactor legacy structures, and supports modern collaboration. It is built for teams that live inside relational databases and want a faster, cleaner way to design, review, and document them.
dbdiagram and Draw.io are solid tools and many teams will continue to use them. What makes ChartDB feel more future proof is the combination of:
AI assisted schema generation and editing
Strong support for large schemas
A modern, developer focused interface
If you care about building and evolving serious data systems, those things matter.
You do not have to take my word for it. Try all three tools with the same schema, the same way I did for this comparison. See which one feels less like work and more like a real partner.
If you want to start with ChartDB, you can try it for free and generate your first AI powered ERD in a few minutes.
👉 Try ChartDB today and see how it fits into your team’s database workflow.
Oh, and by the way, I have made a similar comparison of Dbdiagram vs DrawSql vs ChartDB, do check that out too 🙂
Additional Resources
Introduction
If you work with databases long enough, you eventually end up in the same situation.
Someone asks a simple question like “Where does this field come from” and suddenly you are digging through SQL files, old wiki pages, and screenshots from three years ago.
Tools like dbdiagram, Draw.io, and ChartDB already exist to solve exactly that problem. They help you visualise your database schema, understand relationships, and communicate structure to the rest of the team.
Whether you are already using one of them and are thinking about a switch, or you are starting from scratch and comparing options, this guide will walk you through a clear, side by side breakdown.
Hi, I am Jonathan, founder of ChartDB. I have spent the last years building tools around database schemas and ER diagrams, and I have used all three of these tools in real work. This comparison is based on actual testing. I created the same simple demo schema in each one, clicked around, and paid attention to what felt smooth and what did not. You can include screenshots of those three diagrams in the final post to show that this was tested for real.
My goal here is to help you pick the right tool for your team, even if that choice is not ChartDB.
We have built this small comparison guide to pick you the right one for your team.
Let’s get started!!
How We Compare dbdiagram, Draw.io, and ChartDB
To keep this fair and practical, I looked at how each tool performs across a few important areas:
Import and sync from an existing database
Supported databases and formats
Collaboration and sharing
Export options
AI capabilities
Performance with larger schemas
Templates and examples
Integrations
Hosting and security
Pricing and limits
Customer support and product care
You can always add more criteria for your own use case. For most data teams, these are the ones that matter day to day.
dbdiagram
dbdiagram.io is a popular web based ERD tool built mainly for developers. Instead of dragging tables onto a canvas, you write a small DSL (domain specific language) or paste SQL, and dbdiagram generates the diagram for you.
It is simple, fast, and great if you like to stay close to code. Many teams use it for quick sketches or sharing small schemas with others.
In my test, I built a small SaaS schema with users, teams, projects, and subscriptions. It took only a few minutes to write the DSL and get a clean diagram. This is where you can add a screenshot of that diagram.
Features and experience
Import and modeling
You can import from SQL or create schemas with their DSL. There is no live sync to a running database. It is more of a design and documentation tool than a schema management platform.
Supported databases
Supports multiple SQL dialects, and you can export SQL for engines like PostgreSQL, MySQL, and others. It does not focus on non relational or multi model databases.
Collaboration and sharing
You can share public links and invite collaborators. It is good enough for small teams that want to comment or tweak diagrams together, but it is not built as a full collaborative workspace.
Export options
You can export to SQL and images. That covers most basic needs for docs and reviews.
AI capabilities
Currently, dbdiagram is mostly manual or DSL based. It does not feel like an AI native tool. You are responsible for writing or importing the schema structure yourself.
Performance
For small to medium sized schemas it works well. When diagrams get very large, the simple canvas can start to feel crowded.
Templates and examples
Has some templates and examples, which help you get started, especially if you are new to ERDs.
Hosting and security
It is a hosted SaaS. If you need self hosting or strict on prem requirements, you may need another option for sensitive schemas.
Pricing
dbdiagram has a free plan that works nicely for individuals or very small teams with a limited number of diagrams. Paid plans add more diagrams, private projects, and collaboration features.
For most teams, the usual pattern is: start on the free plan, then upgrade once you want to store multiple schemas or invite more developers.
Check their official pricing page for up to date details.
Draw.io (diagrams.net)
Draw.io (also known as diagrams.net) is a general purpose diagramming tool. People use it for flowcharts, architecture diagrams, mind maps, and yes, ERDs too. It is free, open source, and runs entirely in the browser or inside tools like Confluence.
Draw.io is not a database specific tool, but you can absolutely create ER diagrams with it if you are willing to draw everything manually.
For this comparison, I recreated the same SaaS schema in Draw.io. The result looked fine visually, but it took more manual work. This is where you can add the screenshot of that diagram.
Features and experience
Import and modeling
There is no native database import for schemas. You create tables by hand and connect them with lines. If you want more database awareness, you have to build your own shapes or templates.
Supported databases
Draw.io does not care about specific database engines. It treats everything as generic shapes. That is flexible, but it also means you get no database specific validation or automation.
Collaboration and sharing
You can store diagrams in Google Drive, OneDrive, Git, or inside Confluence. Collaboration depends on where you host the file. It works, but it is not focused on real time collaboration around database schemas.
Export options
Strong on exports. You can export to PNG, SVG, PDF, and more. This is great for documentation.
AI capabilities
Draw.io does not focus on AI generated ERDs. You draw things yourself. There may be small helpers or plugins, but it is not built as an AI first modeling tool.
Performance
Draw.io can handle quite large diagrams, but once you have many tables, it turns into a classic whiteboard problem. It is easy to lose structure when everything is just manual shapes.
Templates and examples
There are many diagram templates, including ERD shapes. They help, but they are generic.
Integrations
Excellent if your company already uses Atlassian tools. Integration with Confluence and Jira is a strong point. It also plays well with popular cloud drives.
Hosting and security
You can run Draw.io locally, inside your own infrastructure, or purely in the browser. This is a big plus if you want control over where data lives.
Pricing
The core tool is free and open source. You only pay if you use it as an add on with products like Confluence or Jira, where billing flows through those platforms.
If you want a general diagramming tool and do not mind drawing schemas by hand, Draw.io is very cost effective.
ChartDB
ChartDB is the tool I am building with my co-founder. It is a modern, AI native database visualization and ERD tool, created specifically for developers and data teams.
You can import a schema from SQL or a live database, generate diagrams from natural language, and then refine everything visually with strong AI support. It is designed to handle both small and large schemas without feeling heavy.
For this comparison, I created the same SaaS schema in ChartDB. The AI Agent generated the first version from a text prompt, and then I tweaked layout and colors. This is where you can include the screenshot of the ChartDB diagram.
Features and experience
Import and sync from existing databases
You can import schemas from SQL, DB dumps, or connect to databases like PostgreSQL, MySQL, SQL Server, SQLite, and others. ChartDB is built to feel “close to the metal” for actual databases, not just toy examples.
Supported databases
ChartDB focuses on relational databases and supports multiple dialects. You can also use it for logical modeling, even if you have not created the physical database yet.
AI capabilities
This is where ChartDB really stands out.
With the AI Agent you can:
Ask the AI to suggest foreign keys and fix missing relationships
Add timestamps, soft deletes, and other patterns across all tables
Refactor names, group tables by domain, and clean up legacy schemas
The idea is simple. Let AI remove the grunt work and let you focus on good design.
Editing, customization, and large schemas
The editor is built for real world work. You can:
Drag and drop tables
Color code by domain
Group tables into areas
Add notes and annotations
ChartDB is optimized for large schemas. You can zoom, filter by schema or area, and still stay oriented even when you have dozens or hundreds of tables.
Collaboration and sharing
You can invite teammates, share links, and work together on diagrams. ChartDB works well for reviews, architecture discussions, and onboarding sessions.
Export options
You can export diagrams to images or SQL. For many users, the flow is: design visually, then export DDL, then apply to the database.
Templates and examples
There are growing sets of templates, and the AI makes it easy to bootstrap a schema from a simple idea like “multi-tenant SaaS with billing, permissions, and audit logs”.
Integrations, hosting, and security
ChartDB is available as a cloud service. There is also an open source core, which is important if you care about self hosting or transparency.
Pricing
ChartDB has a free plan that is generous enough to try it on real schemas. Paid plans unlock more diagrams, AI usage, and team collaboration options.
Most small teams start with the free plan or a basic paid tier, then scale up as they move more projects into ChartDB and expand collaboration.
You can always check the pricing page on chartdb.io for the latest details.
Comparison Table
Feature | dbdiagram | Draw.io | ChartDB |
Primary focus | Code first ERDs | General purpose diagrams | Database visualization and ERDs for data teams |
Input methods | DBML, SQL | Manual drawing with shapes | SQL, live DB import, natural language prompts |
Import from existing DB | SQL or DBML only | No native DB import | Yes, from live databases and SQL dumps |
AI capabilities | None | None | AI agent for generating and editing schemas |
Collaboration | Basic sharing and team access | File based, works via Drive or Confluence | Built in sharing for reviews and team collaboration |
Performance on large ERDs | Good for small and medium diagrams | Can become crowded with many manual shapes | Optimized for large schemas with colors and areas |
Templates and examples | Some examples and community snippets | Many generic diagram templates | Templates plus AI generated starters |
Export options | SQL, DBML, images | PNG, SVG, PDF, and more | SQL in multiple dialects, images |
Embeds | Via exported images | Easy to embed files in docs and Confluence | Shareable links and embeds for live diagrams |
Hosting and security | Hosted SaaS only | Browser, desktop, or inside your own stack | Cloud app plus open source self hosted core |
Pricing entry point | Free plan with limits | Core app is free and open source | Free plan with paid tiers for teams and more AI usage |
Best suited for | Developers who like code based schema design | Teams that need many kinds of diagrams | Teams that want AI help and work with real world DBs |
Final Verdict: Which Tool Should You Use
Each of these tools has real strengths. The right choice depends on how you work and what you need.
dbdiagram is best if you love a code like workflow and want a fast, simple way to create ERDs from DSL or SQL. It shines for quick diagrams and developer centric teams that do not need heavy AI or live sync.
Draw.io is best if you want a general diagramming tool and only occasionally need to draw ERDs. It is flexible, free, and great for companies already deep into Confluence or generic diagrams, but it lacks database specific automation.
ChartDB is best if you want an AI powered database visualization tool that handles real world schemas, helps you refactor legacy structures, and supports modern collaboration. It is built for teams that live inside relational databases and want a faster, cleaner way to design, review, and document them.
dbdiagram and Draw.io are solid tools and many teams will continue to use them. What makes ChartDB feel more future proof is the combination of:
AI assisted schema generation and editing
Strong support for large schemas
A modern, developer focused interface
If you care about building and evolving serious data systems, those things matter.
You do not have to take my word for it. Try all three tools with the same schema, the same way I did for this comparison. See which one feels less like work and more like a real partner.
If you want to start with ChartDB, you can try it for free and generate your first AI powered ERD in a few minutes.
👉 Try ChartDB today and see how it fits into your team’s database workflow.
Oh, and by the way, I have made a similar comparison of Dbdiagram vs DrawSql vs ChartDB, do check that out too 🙂
Additional Resources

Continue Reading


© 2026 ChartDB
Product
Free Tools
© 2025 ChartDB
Product
Free Tools
© 2025 ChartDB