
Jan 14, 2026
Data Modeling for ClickHouse: How to Optimize Schemas for High-Speed Analytics
Data Modeling for ClickHouse: How to Optimize Schemas for High-Speed Analytics
Data Modeling for ClickHouse: How to Optimize Schemas for High-Speed Analytics
Learn how to design efficient data models for ClickHouse. Discover best practices to optimize schemas for high-speed analytics and large-scale performance.
Learn how to design efficient data models for ClickHouse. Discover best practices to optimize schemas for high-speed analytics and large-scale performance.
Learn how to design efficient data models for ClickHouse. Discover best practices to optimize schemas for high-speed analytics and large-scale performance.

Jonathan Fishner
11 minutes read
TLDR;
TLDR;
• Why ClickHouse is different: It stores data by column, so your partitioning and sorting key choices directly affect how data is read from disk.
• What goes wrong: Schema mistakes in ClickHouse are expensive to fix once data grows, making upfront planning essential.
• Key practices: Choose sorting keys that match your most common queries, partition by time, and avoid over-normalizing.
• How ChartDB helps: Plan and document your ClickHouse schema visually before writing SQL, so your team can review the model before data lands.
Introduction
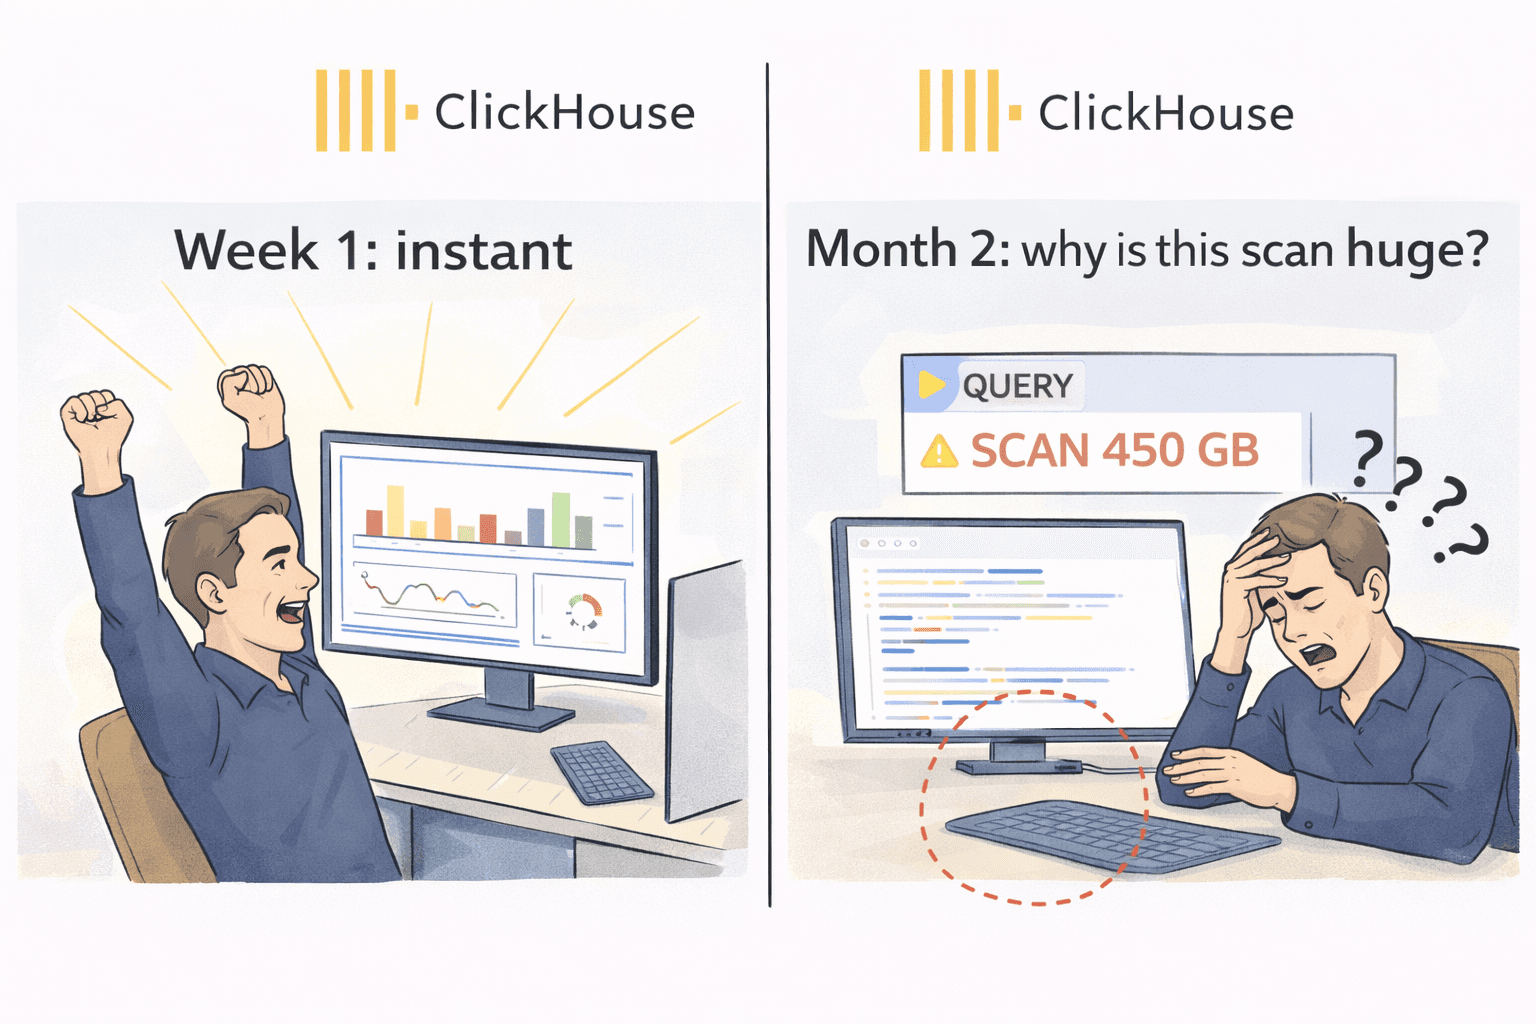
The first week you adopt ClickHouse usually feels like magic.
You point a dashboard at it, run a couple of queries, and everything is instant. People get excited. Someone says, “Why didn’t we do this earlier?”
Then real data shows up.
A month later the tables are huge, a few queries are suddenly slow, and you start seeing expensive scans. That is the ClickHouse reality: it is incredibly fast by design, but only when you model the data the way ClickHouse expects.
In ClickHouse, schema design is not just “columns and types.” Your partitioning and sorting decisions become part of how the data is stored on disk. If those choices are off, you pay with performance, cost, and painful rebuilds.
I’m Jonathan, co-founder of ChartDB. ChartDB helps teams visualize and plan database schemas, then keep that model documented and shareable as systems evolve. For analytics databases like ClickHouse, planning matters even more because the “fix it later” option is usually expensive.
Here’s what you’ll get in this guide:
A high level explanation of what ClickHouse is and why it behaves differently
Why schema mistakes are harder to undo once data grows
A practical workflow to model first and implement second
How ChartDB helps teams plan, document, and review ClickHouse schemas before writing ClickHouse SQL
What ClickHouse Is (High Level)
ClickHouse is a columnar analytics database built for fast reads over large datasets. It is great for event analytics, logs, clickstreams, metrics, and any workload where you mostly insert data and then run a lot of aggregations.
If you are used to OLTP databases like Postgres or MySQL, ClickHouse feels different because it is not optimized for “update a single row and return immediately.” It shines when you ask questions like:
“Count events per minute for the last 90 days”
“Group revenue by plan and region”
“Find top users by activity in a time window”
That performance comes from how it stores data. Which is why your schema choices matter so much.
Why Schema Design Is So Critical in ClickHouse
Partitioning and sorting are baked into storage
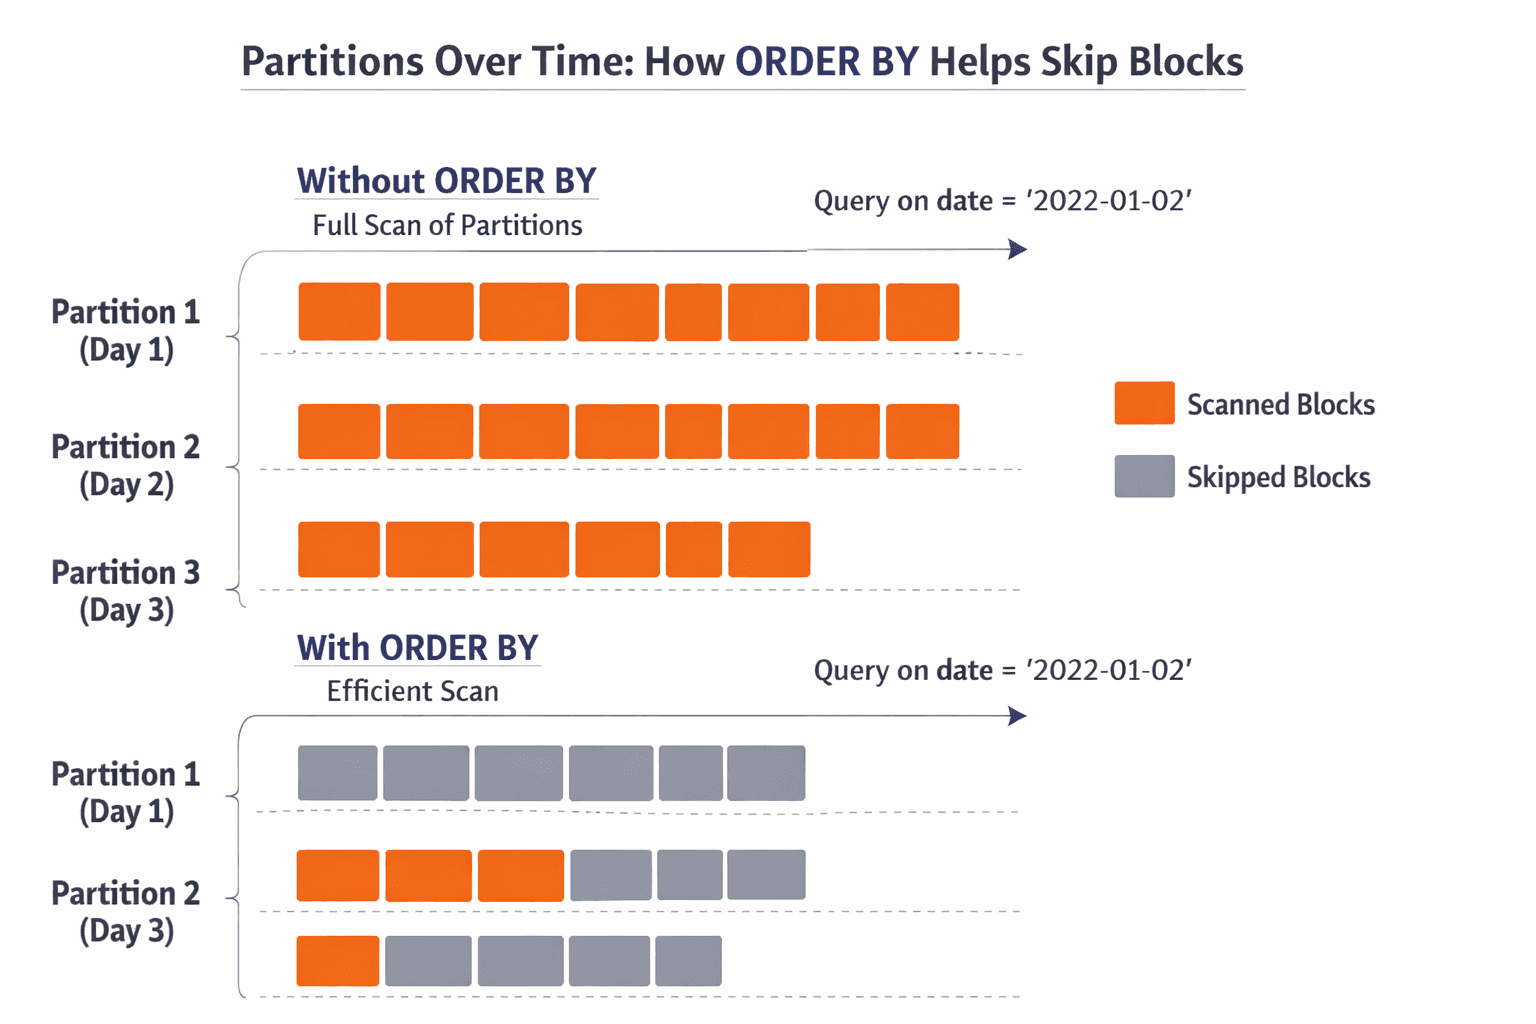
In ClickHouse, you do not just create a table. You choose an engine, you decide a partition key, and you define an ORDER BY sorting key. Those choices shape how the data lands on disk, how it can be skipped, and how quickly queries can narrow down what to read.
If your ORDER BY aligns with your most common filters, ClickHouse can skip a lot of data. If it doesn’t, it often reads way more than you expect.
Changing a bad schema later often means rebuilding tables
A painful ClickHouse truth: once a table is huge, “just change the schema” is not a casual task.
Many changes require rebuilding the table or creating a new one with a better partition and sorting strategy, then re-ingesting everything.
Re-ingesting large datasets is time consuming and costly
If you are ingesting billions of rows, rebuilding is not just slow. It impacts compute costs, storage, and your team’s time. It also creates operational risk because you will run two tables for a while and you need to keep them consistent.
Poor schema decisions lead to slow queries and wasted compute
A schema that does not match query patterns forces ClickHouse to scan more columns and more parts than necessary. The database is still fast, but you are paying for speed by throwing hardware at a model problem.
ClickHouse does not give you a nice visual modeling experience
Most ClickHouse schema work happens in raw SQL. That is fine for small tables. It gets rough when you have wide event tables, dozens of supporting tables, and multiple teams making changes.
This is where visual schema planning makes a real difference.
How Teams Usually Design ClickHouse Schemas (and Why It’s Risky)
Here is the common workflow I see:
Someone writes a CREATE TABLE in a PR, based on what they think the queries will be. Partitioning and ORDER BY are guessed. The table ships. Then the dataset grows, a dashboard gets slower, and you start doing trial and error.
This approach leads to a few predictable problems.
You discover performance issues only after the data is large enough to hurt. At that point, your “cheap fix” becomes a rebuild.
Documentation is also usually weak. The most important choices, partitioning and sorting, live in a SQL file with no context. When someone asks “why did we partition by this?” the answer is often a shrug.
Collaboration gets awkward too. Analytics engineers, backend engineers, and data folks all touch the schema, but they are not always reviewing the model together. Without a shared diagram, people miss the bigger picture.
Real pain point number one: wide event tables become dumping grounds. Columns get added with no structure, types drift, and nobody knows which fields are actually used.
Real pain point number two: people model joins like it is Postgres. ClickHouse can do joins, but the best performing ClickHouse designs often minimize unnecessary joins for common queries.
How ChartDB Helps You Create ClickHouse Schemas Faster and Safer
ChartDB is not a ClickHouse admin console and it does not run your analytics queries.
ChartDB sits one layer earlier. It is a planning and visualization layer that helps teams design schemas with more clarity before they implement them in ClickHouse.
Here is how teams use ChartDB for ClickHouse modeling:
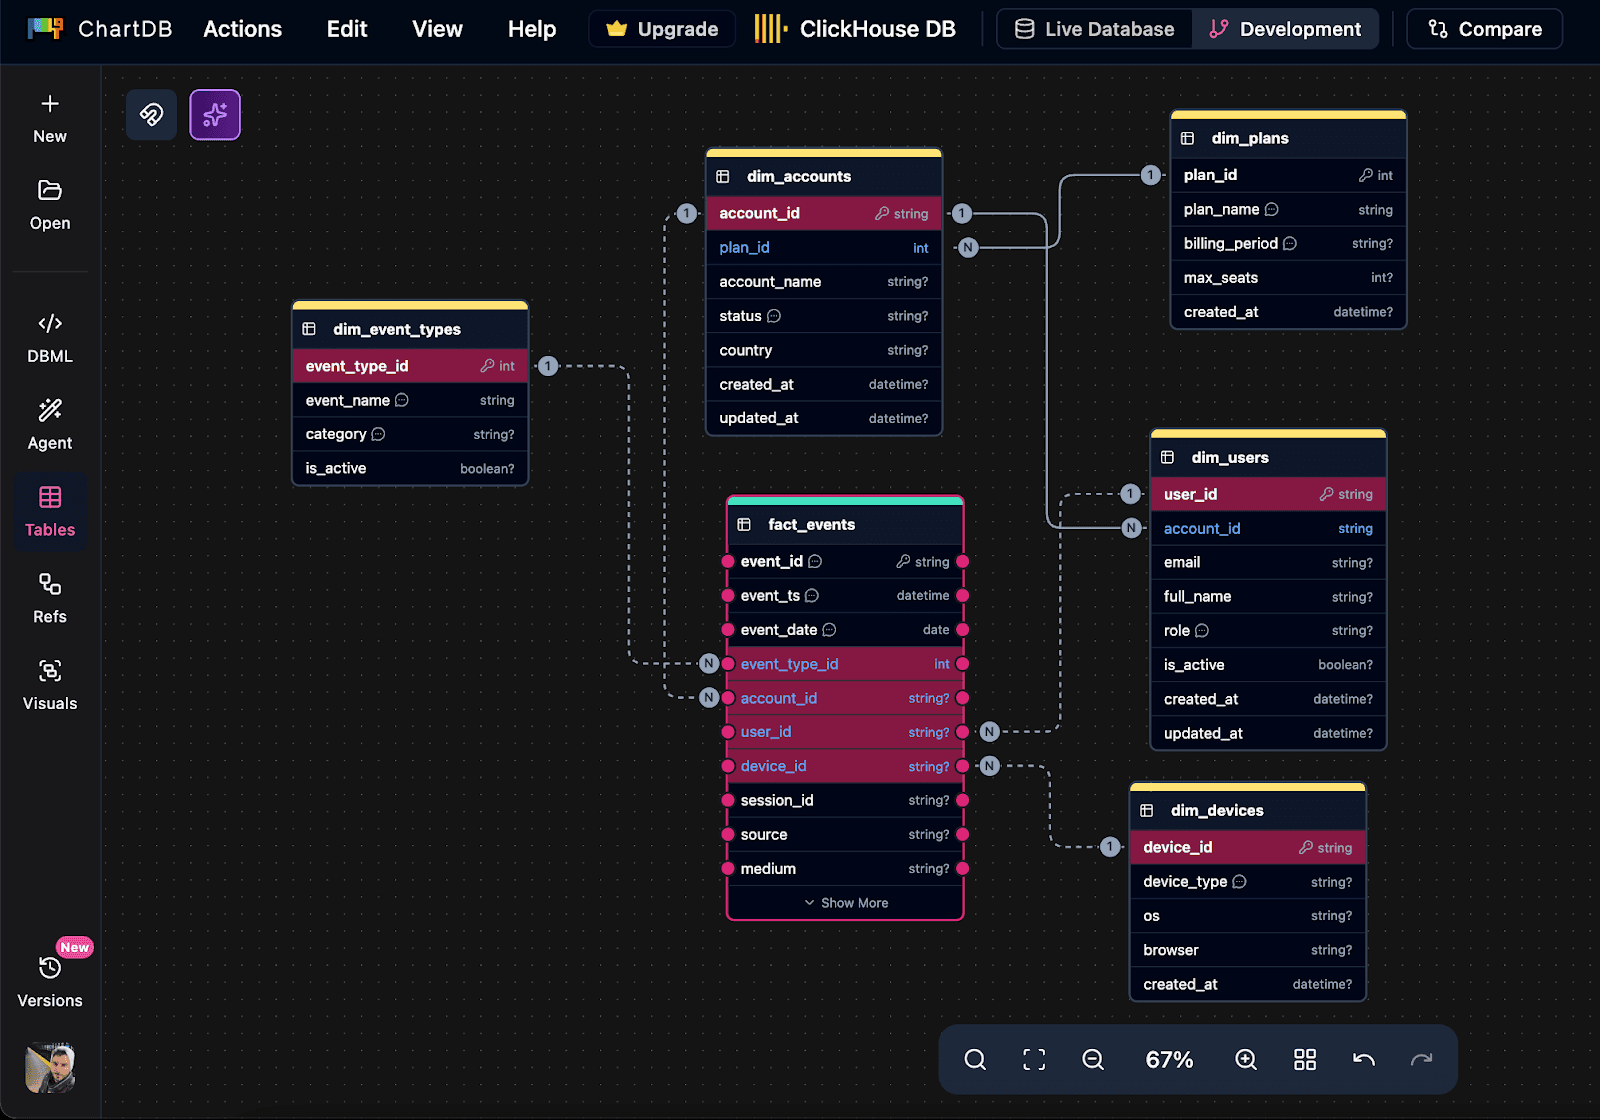
Design ClickHouse table structures visually
You can map out the main fact table and the supporting entities, then see how everything connects. This helps you catch schema sprawl early.
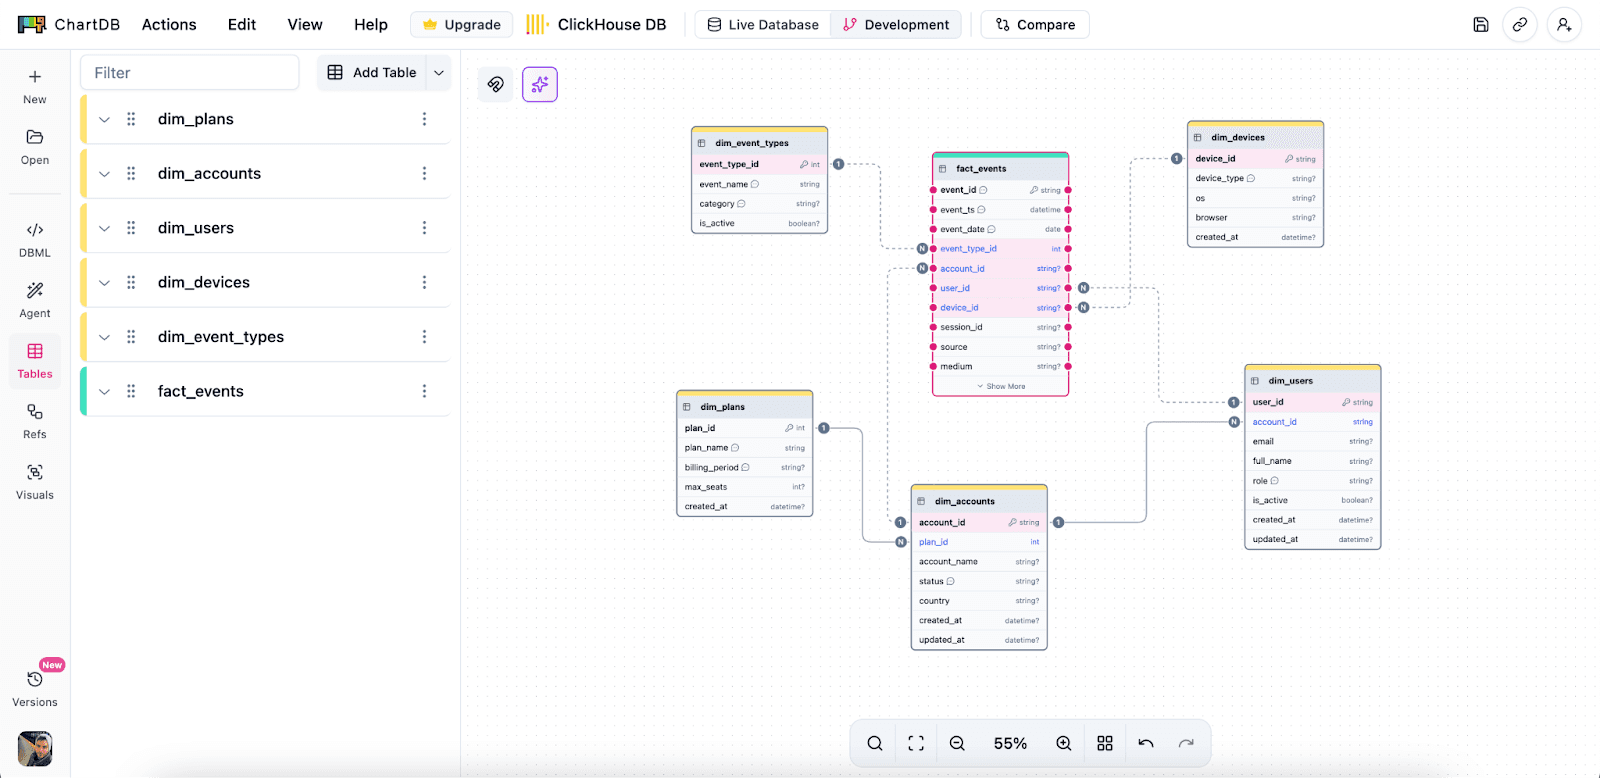
Organize wide analytics tables
Wide tables are normal in analytics. The trick is keeping them understandable. With a visual layout, notes, and grouping, you can make a wide schema feel navigable.
Plan partition and sorting strategies
In ClickHouse, partition and ORDER BY decisions are the big levers.
In ChartDB, teams document those choices right next to the table as notes. That sounds simple, but it changes behavior. People stop saying “we’ll decide later,” because the decision is visible.
Document schema decisions clearly
The diagram becomes your shared reference. It is not just tables. It is the reasoning behind the model.
That is especially useful when a new teammate joins and needs to understand why things were shaped a certain way.
Step by step: Design in ChartDB, then implement in ClickHouse
Note: I’m writing this as a practical flow. Your exact steps might differ based on how you ingest data and how your team manages migrations. Once you test this end to end, you can replace the placeholders below with real screenshots.
Step 1: Start with the query patterns
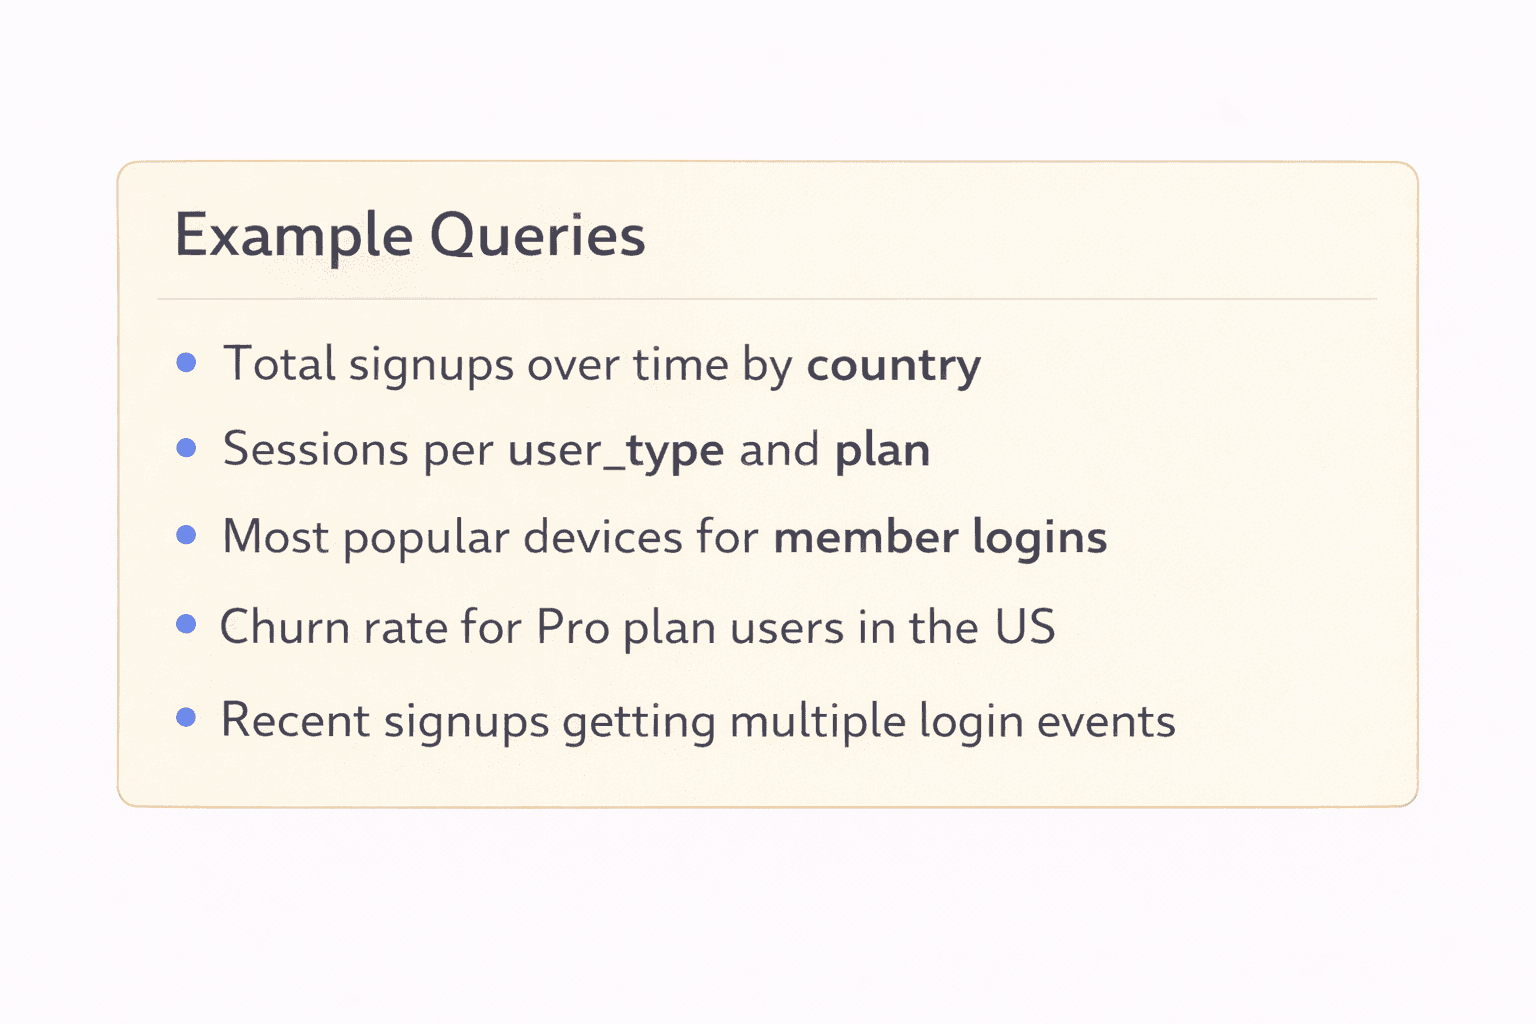
Before you write any ClickHouse SQL, write down the 5 to 10 most common queries you expect.
Be specific. Things like:
“Filter by event_time for last 7 days”
“Group by account_id and day”
“Top users by events in a time range”
This list will guide your partitioning and ORDER BY strategy. If you skip this step, you are basically guessing.
Step 2: Create the core tables in ChartDB
Add your main fact table first. For ClickHouse, this is usually an events, logs, metrics, or transactions table.
Then add the supporting tables you actually need. Try not to model twenty “maybe later” tables. ClickHouse schemas get messy when the model is vague.
Define columns and types with real intent. If a field has high cardinality, say it. If it is often filtered, note it.
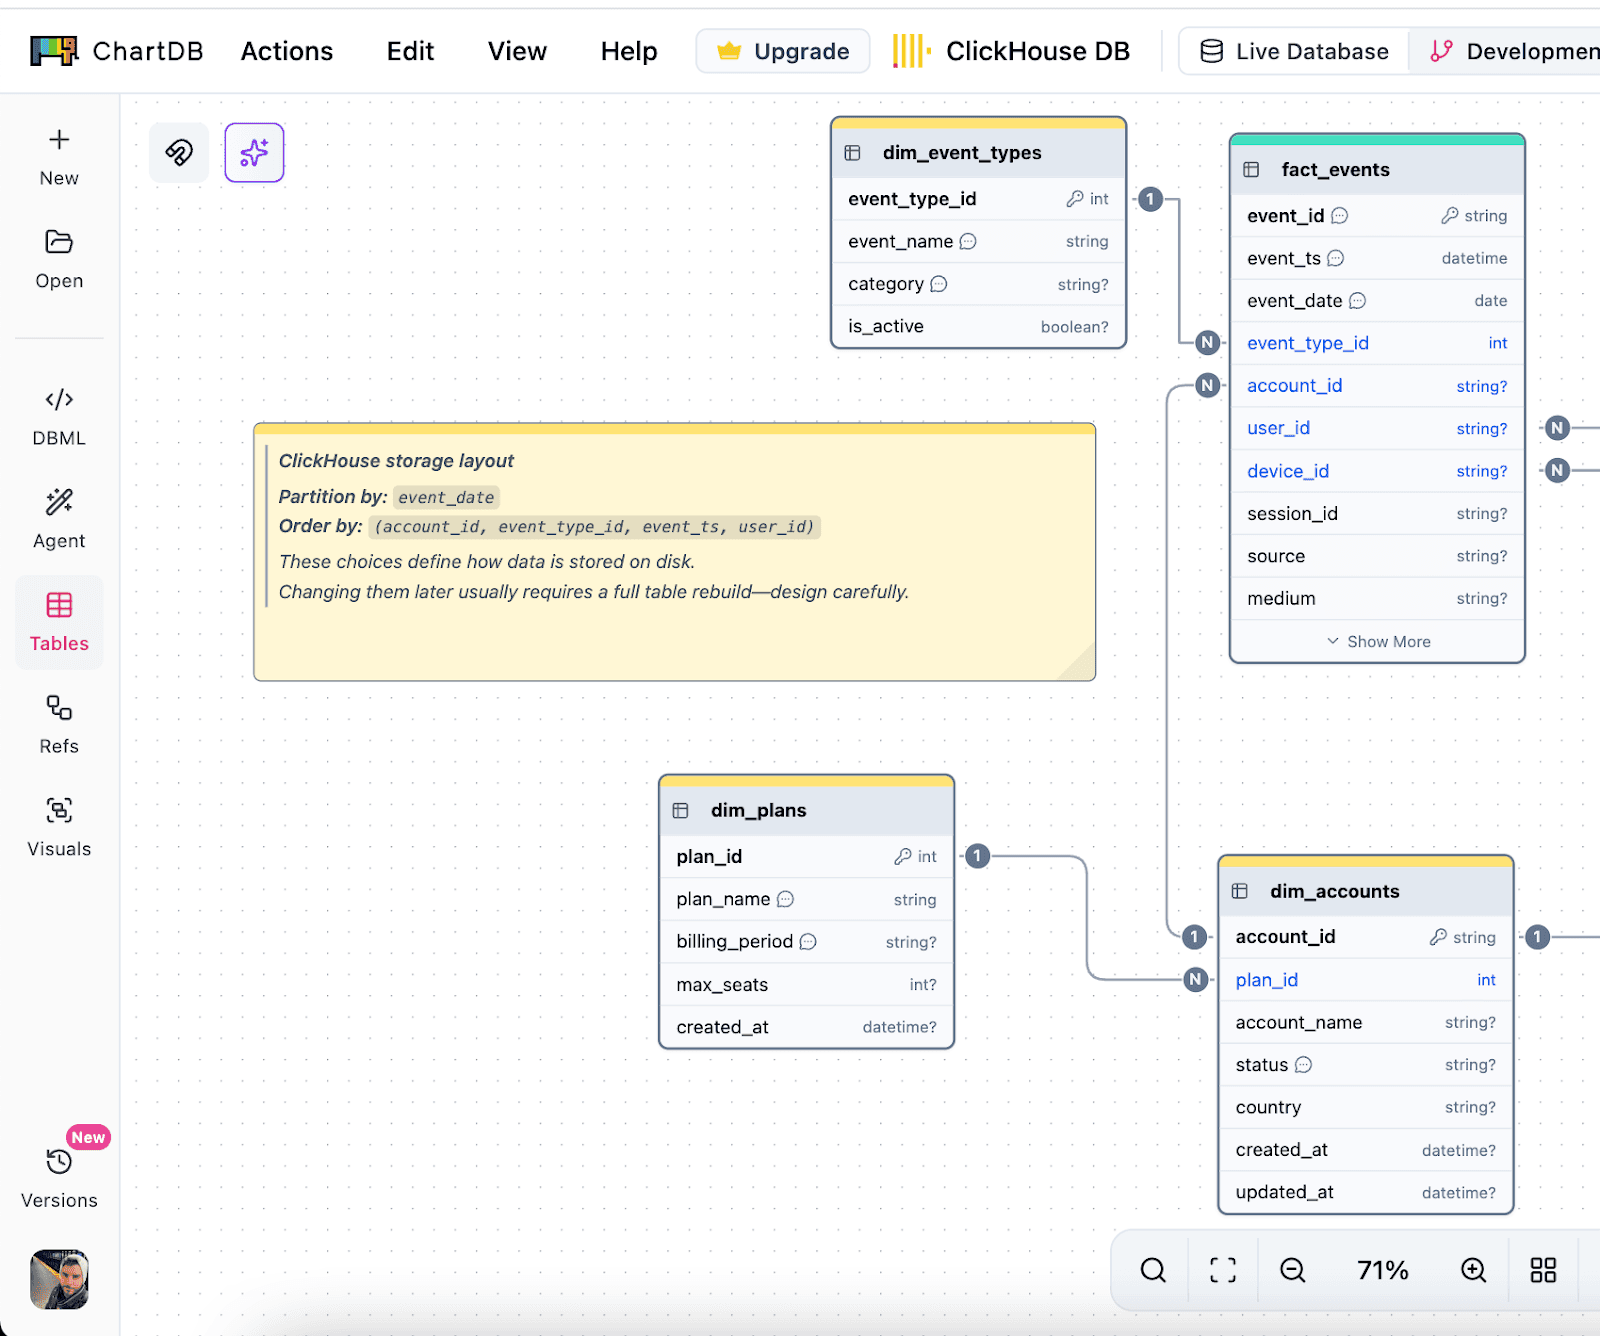
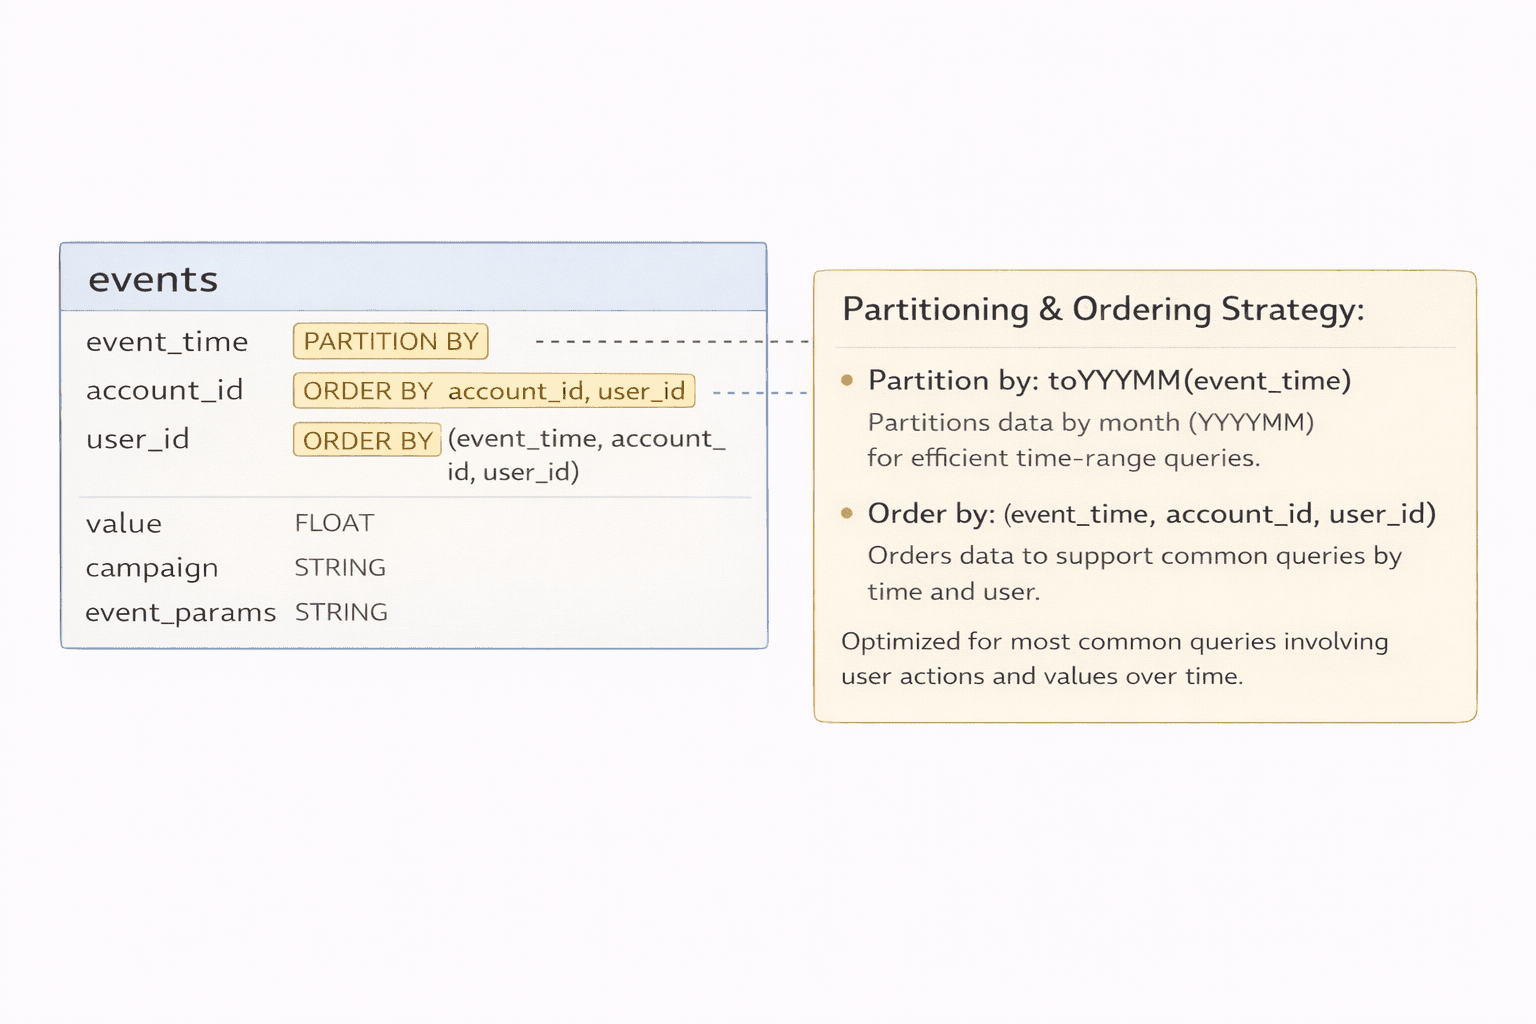
Step 3: Document partitioning and sorting decisions inside the diagram
Add clear notes directly on the table. Example:
Partition by: toYYYYMM(event_time)
Order by: (event_time, account_id, user_id)
If you have multiple access patterns, capture them too. The goal is that a teammate can look at the diagram and understand the design, not just the table name.
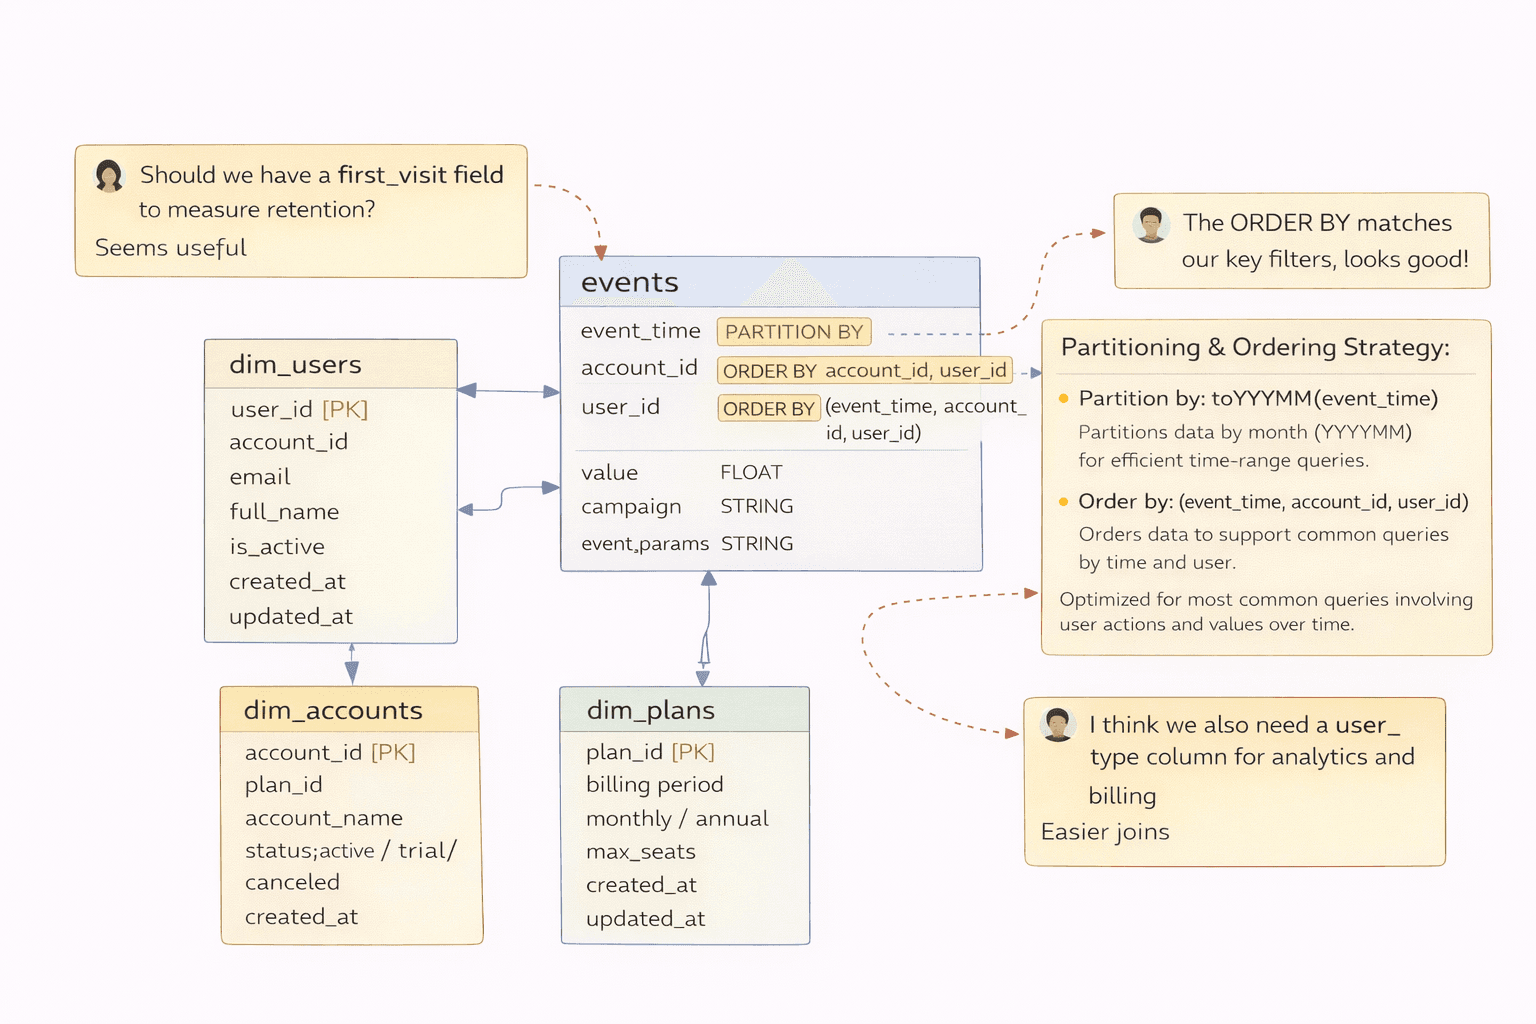
Step 4: Review the schema visually with the team
This step is where you save money.
Pull in the people who will query it. Analytics, backend, whoever owns dashboards. Ask:
Are we missing fields we will definitely need?
Are types reasonable?
Do we really need this join for common queries?
Does the ORDER BY reflect the filters we actually use?
Catching mistakes here is cheap. Catching them after re-ingesting 10 TB is not.
Step 5: Translate the approved schema into ClickHouse SQL
Now you create the table in ClickHouse using the same column definitions, plus the engine, partition key, and sorting key.
Example skeleton:
CREATE TABLE events (
event_time DateTime,
account_id UInt64,
user_id UInt64,
event_name LowCardinality(String),
properties_json String
)
ENGINE = MergeTree
PARTITION BY toYYYYMM(event_time)
ORDER BY (event_time, account_id, user_id);
The point is not that this is the best schema. The point is that the schema was decided with visibility first.
Step 6: Load data and validate against the original queries
Load a representative sample, then run the query list from step 1.
If something is slow, you adjust early while the dataset is still small. That is the sweet spot.
Once the table is massive, schema changes tend to become migrations that nobody wants to touch.
The payoff
Designing schemas visually first usually leads to fewer schema rebuilds, less wasted compute, and better long term stability as data volume grows.
You do not need a perfect model. You just need fewer expensive mistakes.
Conclusion
ClickHouse is one of the best tools out there for high speed analytics. But it only stays fast when your schema is designed with ClickHouse in mind.
Bad partitioning and sorting choices are costly to fix once data grows, which is why upfront planning is not “nice to have.” It is the difference between a database that feels effortless and one that slowly becomes a fire drill.
ChartDB helps teams design and validate ClickHouse schemas visually before writing SQL, so you can catch issues early and keep the model understandable as it evolves.
If you are building on ClickHouse, try ChartDB and plan your schema the right way from day one.
More ChartDB resources
Introduction
The first week you adopt ClickHouse usually feels like magic.
You point a dashboard at it, run a couple of queries, and everything is instant. People get excited. Someone says, “Why didn’t we do this earlier?”
Then real data shows up.
A month later the tables are huge, a few queries are suddenly slow, and you start seeing expensive scans. That is the ClickHouse reality: it is incredibly fast by design, but only when you model the data the way ClickHouse expects.
In ClickHouse, schema design is not just “columns and types.” Your partitioning and sorting decisions become part of how the data is stored on disk. If those choices are off, you pay with performance, cost, and painful rebuilds.
I’m Jonathan, co-founder of ChartDB. ChartDB helps teams visualize and plan database schemas, then keep that model documented and shareable as systems evolve. For analytics databases like ClickHouse, planning matters even more because the “fix it later” option is usually expensive.
Here’s what you’ll get in this guide:
A high level explanation of what ClickHouse is and why it behaves differently
Why schema mistakes are harder to undo once data grows
A practical workflow to model first and implement second
How ChartDB helps teams plan, document, and review ClickHouse schemas before writing ClickHouse SQL
What ClickHouse Is (High Level)
ClickHouse is a columnar analytics database built for fast reads over large datasets. It is great for event analytics, logs, clickstreams, metrics, and any workload where you mostly insert data and then run a lot of aggregations.
If you are used to OLTP databases like Postgres or MySQL, ClickHouse feels different because it is not optimized for “update a single row and return immediately.” It shines when you ask questions like:
“Count events per minute for the last 90 days”
“Group revenue by plan and region”
“Find top users by activity in a time window”
That performance comes from how it stores data. Which is why your schema choices matter so much.
Why Schema Design Is So Critical in ClickHouse
Partitioning and sorting are baked into storage
In ClickHouse, you do not just create a table. You choose an engine, you decide a partition key, and you define an ORDER BY sorting key. Those choices shape how the data lands on disk, how it can be skipped, and how quickly queries can narrow down what to read.
If your ORDER BY aligns with your most common filters, ClickHouse can skip a lot of data. If it doesn’t, it often reads way more than you expect.
Changing a bad schema later often means rebuilding tables
A painful ClickHouse truth: once a table is huge, “just change the schema” is not a casual task.
Many changes require rebuilding the table or creating a new one with a better partition and sorting strategy, then re-ingesting everything.
Re-ingesting large datasets is time consuming and costly
If you are ingesting billions of rows, rebuilding is not just slow. It impacts compute costs, storage, and your team’s time. It also creates operational risk because you will run two tables for a while and you need to keep them consistent.
Poor schema decisions lead to slow queries and wasted compute
A schema that does not match query patterns forces ClickHouse to scan more columns and more parts than necessary. The database is still fast, but you are paying for speed by throwing hardware at a model problem.
ClickHouse does not give you a nice visual modeling experience
Most ClickHouse schema work happens in raw SQL. That is fine for small tables. It gets rough when you have wide event tables, dozens of supporting tables, and multiple teams making changes.
This is where visual schema planning makes a real difference.
How Teams Usually Design ClickHouse Schemas (and Why It’s Risky)
Here is the common workflow I see:
Someone writes a CREATE TABLE in a PR, based on what they think the queries will be. Partitioning and ORDER BY are guessed. The table ships. Then the dataset grows, a dashboard gets slower, and you start doing trial and error.
This approach leads to a few predictable problems.
You discover performance issues only after the data is large enough to hurt. At that point, your “cheap fix” becomes a rebuild.
Documentation is also usually weak. The most important choices, partitioning and sorting, live in a SQL file with no context. When someone asks “why did we partition by this?” the answer is often a shrug.
Collaboration gets awkward too. Analytics engineers, backend engineers, and data folks all touch the schema, but they are not always reviewing the model together. Without a shared diagram, people miss the bigger picture.
Real pain point number one: wide event tables become dumping grounds. Columns get added with no structure, types drift, and nobody knows which fields are actually used.
Real pain point number two: people model joins like it is Postgres. ClickHouse can do joins, but the best performing ClickHouse designs often minimize unnecessary joins for common queries.
How ChartDB Helps You Create ClickHouse Schemas Faster and Safer
ChartDB is not a ClickHouse admin console and it does not run your analytics queries.
ChartDB sits one layer earlier. It is a planning and visualization layer that helps teams design schemas with more clarity before they implement them in ClickHouse.
Here is how teams use ChartDB for ClickHouse modeling:
Design ClickHouse table structures visually
You can map out the main fact table and the supporting entities, then see how everything connects. This helps you catch schema sprawl early.
Organize wide analytics tables
Wide tables are normal in analytics. The trick is keeping them understandable. With a visual layout, notes, and grouping, you can make a wide schema feel navigable.
Plan partition and sorting strategies
In ClickHouse, partition and ORDER BY decisions are the big levers.
In ChartDB, teams document those choices right next to the table as notes. That sounds simple, but it changes behavior. People stop saying “we’ll decide later,” because the decision is visible.
Document schema decisions clearly
The diagram becomes your shared reference. It is not just tables. It is the reasoning behind the model.
That is especially useful when a new teammate joins and needs to understand why things were shaped a certain way.
Step by step: Design in ChartDB, then implement in ClickHouse
Note: I’m writing this as a practical flow. Your exact steps might differ based on how you ingest data and how your team manages migrations. Once you test this end to end, you can replace the placeholders below with real screenshots.
Step 1: Start with the query patterns
Before you write any ClickHouse SQL, write down the 5 to 10 most common queries you expect.
Be specific. Things like:
“Filter by event_time for last 7 days”
“Group by account_id and day”
“Top users by events in a time range”
This list will guide your partitioning and ORDER BY strategy. If you skip this step, you are basically guessing.
Step 2: Create the core tables in ChartDB
Add your main fact table first. For ClickHouse, this is usually an events, logs, metrics, or transactions table.
Then add the supporting tables you actually need. Try not to model twenty “maybe later” tables. ClickHouse schemas get messy when the model is vague.
Define columns and types with real intent. If a field has high cardinality, say it. If it is often filtered, note it.
Step 3: Document partitioning and sorting decisions inside the diagram
Add clear notes directly on the table. Example:
Partition by: toYYYYMM(event_time)
Order by: (event_time, account_id, user_id)
If you have multiple access patterns, capture them too. The goal is that a teammate can look at the diagram and understand the design, not just the table name.
Step 4: Review the schema visually with the team
This step is where you save money.
Pull in the people who will query it. Analytics, backend, whoever owns dashboards. Ask:
Are we missing fields we will definitely need?
Are types reasonable?
Do we really need this join for common queries?
Does the ORDER BY reflect the filters we actually use?
Catching mistakes here is cheap. Catching them after re-ingesting 10 TB is not.
Step 5: Translate the approved schema into ClickHouse SQL
Now you create the table in ClickHouse using the same column definitions, plus the engine, partition key, and sorting key.
Example skeleton:
CREATE TABLE events (
event_time DateTime,
account_id UInt64,
user_id UInt64,
event_name LowCardinality(String),
properties_json String
)
ENGINE = MergeTree
PARTITION BY toYYYYMM(event_time)
ORDER BY (event_time, account_id, user_id);
The point is not that this is the best schema. The point is that the schema was decided with visibility first.
Step 6: Load data and validate against the original queries
Load a representative sample, then run the query list from step 1.
If something is slow, you adjust early while the dataset is still small. That is the sweet spot.
Once the table is massive, schema changes tend to become migrations that nobody wants to touch.
The payoff
Designing schemas visually first usually leads to fewer schema rebuilds, less wasted compute, and better long term stability as data volume grows.
You do not need a perfect model. You just need fewer expensive mistakes.
Conclusion
ClickHouse is one of the best tools out there for high speed analytics. But it only stays fast when your schema is designed with ClickHouse in mind.
Bad partitioning and sorting choices are costly to fix once data grows, which is why upfront planning is not “nice to have.” It is the difference between a database that feels effortless and one that slowly becomes a fire drill.
ChartDB helps teams design and validate ClickHouse schemas visually before writing SQL, so you can catch issues early and keep the model understandable as it evolves.
If you are building on ClickHouse, try ChartDB and plan your schema the right way from day one.
More ChartDB resources

Continue Reading


© 2026 ChartDB
Product
Free Tools
© 2025 ChartDB
Product
Free Tools
© 2025 ChartDB