
Jan 16, 2026
How to Design Effective Schemas for Google BigQuery
How to Design Effective Schemas for Google BigQuery
How to Design Effective Schemas for Google BigQuery
A clear, practical guide on why schema design matters in Google BigQuery and how ChartDB helps teams plan efficient, cost-controlled data models before writing SQL.
A clear, practical guide on why schema design matters in Google BigQuery and how ChartDB helps teams plan efficient, cost-controlled data models before writing SQL.
A clear, practical guide on why schema design matters in Google BigQuery and how ChartDB helps teams plan efficient, cost-controlled data models before writing SQL.

Jonathan Fishner
8 minutes read
TLDR;
TLDR;
• Why it matters: BigQuery charges based on data scanned, so a poorly designed schema directly increases query costs and slows performance.
• Common mistakes: Wide denormalized tables, missing partitioning, and scanning full datasets when only a subset is needed.
• Best practices: Use partitioning, clustering, and nested/repeated fields to reduce scan size and keep queries efficient.
• How ChartDB helps: Visualize and plan your BigQuery schema before writing SQL, so you catch structural issues early and keep costs under control.
Introduction
Google BigQuery is Google’s fully managed, serverless data warehouse. You throw data at it, run SQL on it, and it scales without you babysitting clusters or tuning a million knobs.
That is exactly why teams move to BigQuery. It’s fast, it’s easy to query at scale, and it removes a lot of infrastructure drama.
But here’s the part that surprises people the first time they get the bill.
BigQuery is powerful, but query speed and cost depend entirely on the data structure you give it. If your schema is sloppy, BigQuery will still run the query. It just quietly scans more than it needs to, costs more than it should, and eventually feels slower than you expected.
I’m Jonathan, co-founder of ChartDB. ChartDB helps teams design and visualize database schemas before writing SQL, so the model is clear, reviewable, and easy to share. In analytics systems like BigQuery, that planning step is not “nice to have.” It is how you keep performance predictable and costs under control.
In this guide, I’ll cover:
Why schema design is critical in BigQuery
What goes wrong when schemas are designed poorly
How ChartDB helps teams plan efficient BigQuery models before they ever load data
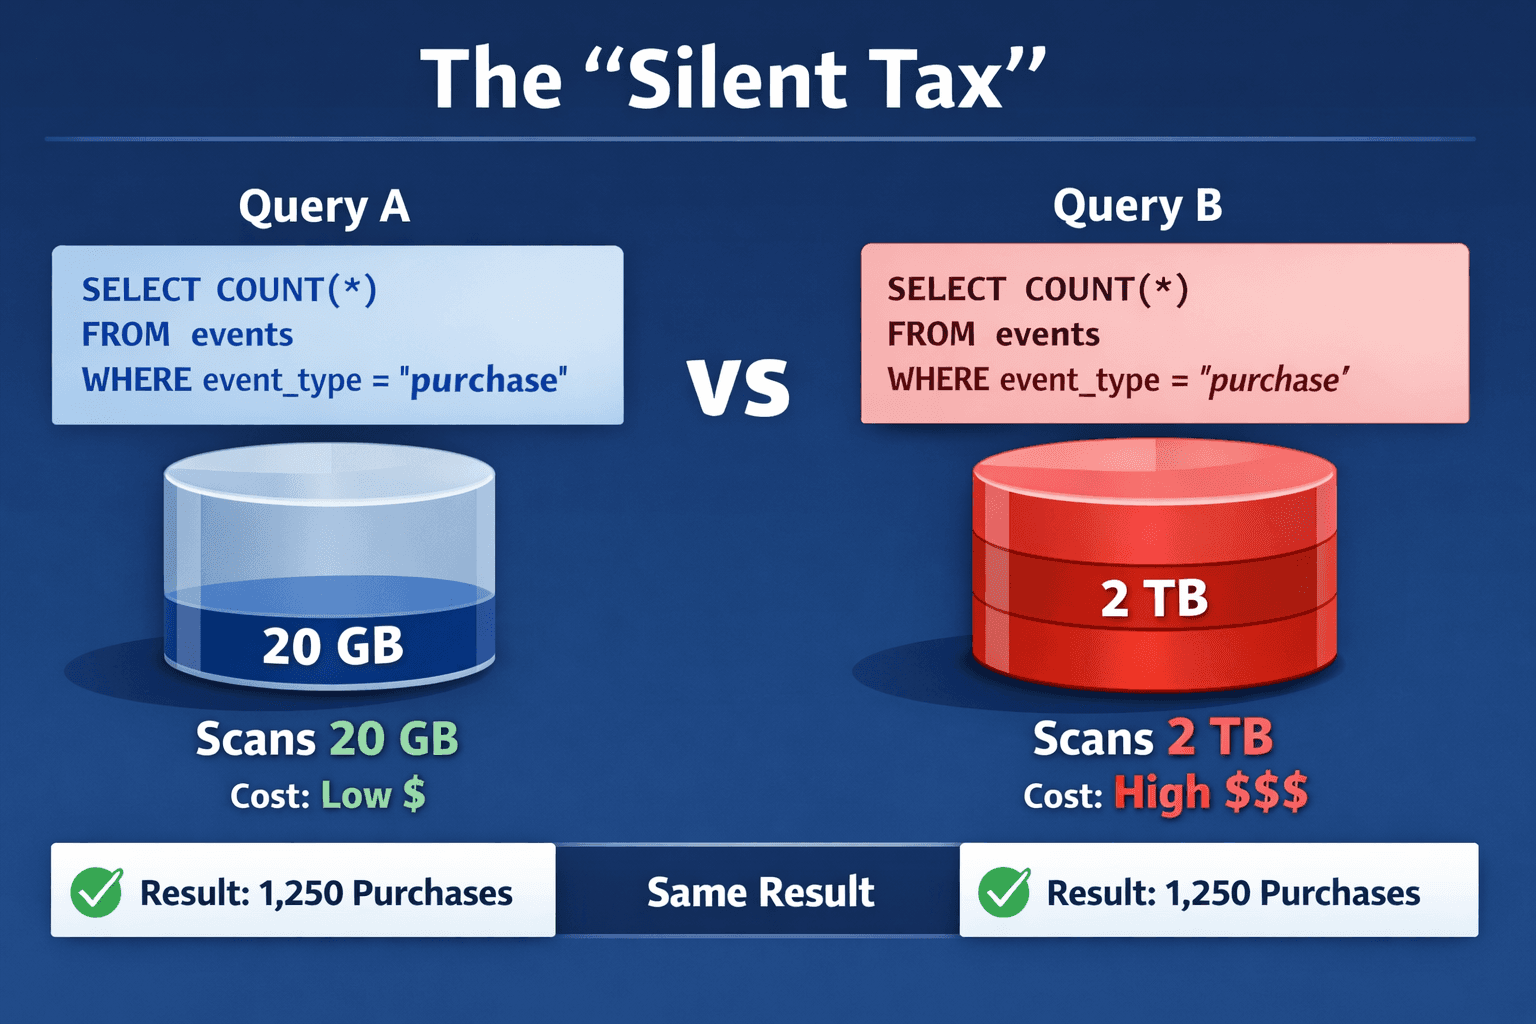
[IMAGE: A simple before and after graphic. Left shows a messy wide table and a pricey query. Right shows partitioned and clustered schema with a cheaper query.]
Why Schema Design Is So Critical in BigQuery
BigQuery schemas are not just column definitions. They are the difference between “this dashboard loads instantly” and “why did this query scan 2 TB.”
BigQuery charges based on data scanned
BigQuery’s pricing model makes schema design feel very real. When a query scans more bytes, it costs more. That means your goal is not only to make queries correct. Your goal is to make them selective.
In practice, that means you want queries to read the smallest possible slice of data.
Flat, wide tables can explode query costs
Wide, flattened tables are tempting. They feel simple. One table, one query, done.
The catch is that wide tables often lead to wide scans. If analysts keep selecting many columns or filtering poorly, your scans balloon. Over time, “simple” becomes “expensive.”
Poor partitioning leads to full table scans
If you have time based data and you do not partition it, BigQuery can end up scanning far more than you think, even for “last 7 days” questions.
Partitioning is your first line of defense against accidental full table scans.
Incorrect data types increase storage and scan size
Data types are not just correctness. They impact storage and query efficiency.
A classic example is using STRING for fields that should be INT or DATE. It works, until it makes everything heavier. More bytes stored, more bytes scanned.
Joins across large tables quickly become expensive
BigQuery can do joins, but it rewards smart modeling.
If you are constantly joining massive fact tables to big dimensions with poor filters, cost and performance can drift in a way that is hard to notice until it is bad.
A key difference from OLTP databases
BigQuery is optimized for analytics, not transactions.
If you model BigQuery like MySQL or Postgres, fully normalized, lots of small tables, heavy joins for every question, you often create pain for analysts and cost for the business.
And here is the sneaky part.
In BigQuery, bad schema design usually does not break queries. It silently increases cost and slows everything down.
How ChartDB Helps You Create BigQuery Schemas Faster and Safer
ChartDB is not BigQuery itself. It does not run your warehouse workloads.
ChartDB sits before BigQuery. It is a planning and visualization layer that helps teams think clearly about structure, relationships, and query patterns before they commit to SQL and ingestion.
Here is what teams use ChartDB for when working on BigQuery.
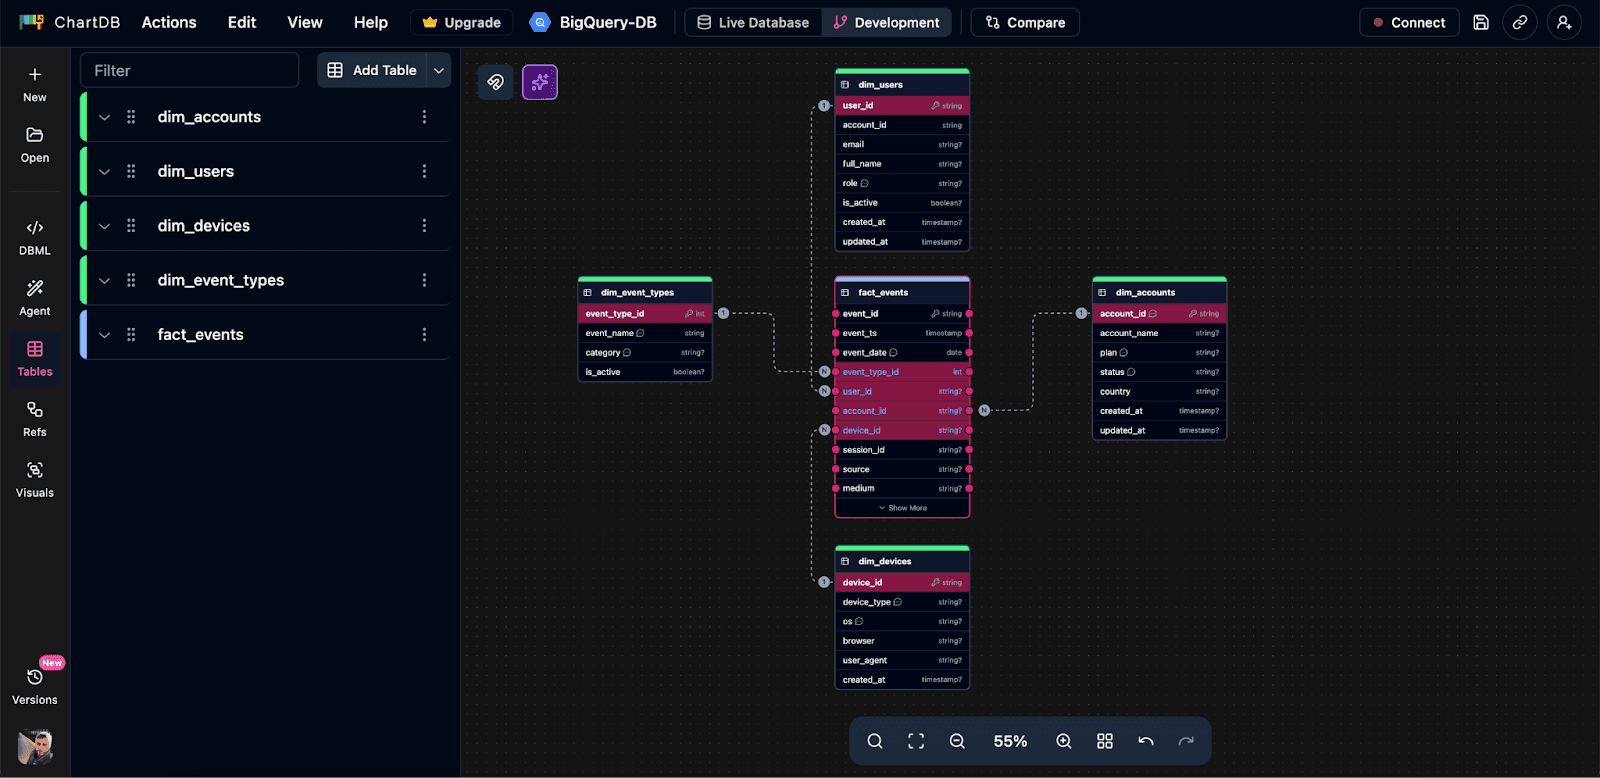
Design BigQuery table structures visually
Instead of staring at raw SQL, you can map out your fact tables and dimensions as a diagram. For teams, this matters because schema design is often a group decision, even if one person writes the final CREATE TABLE.
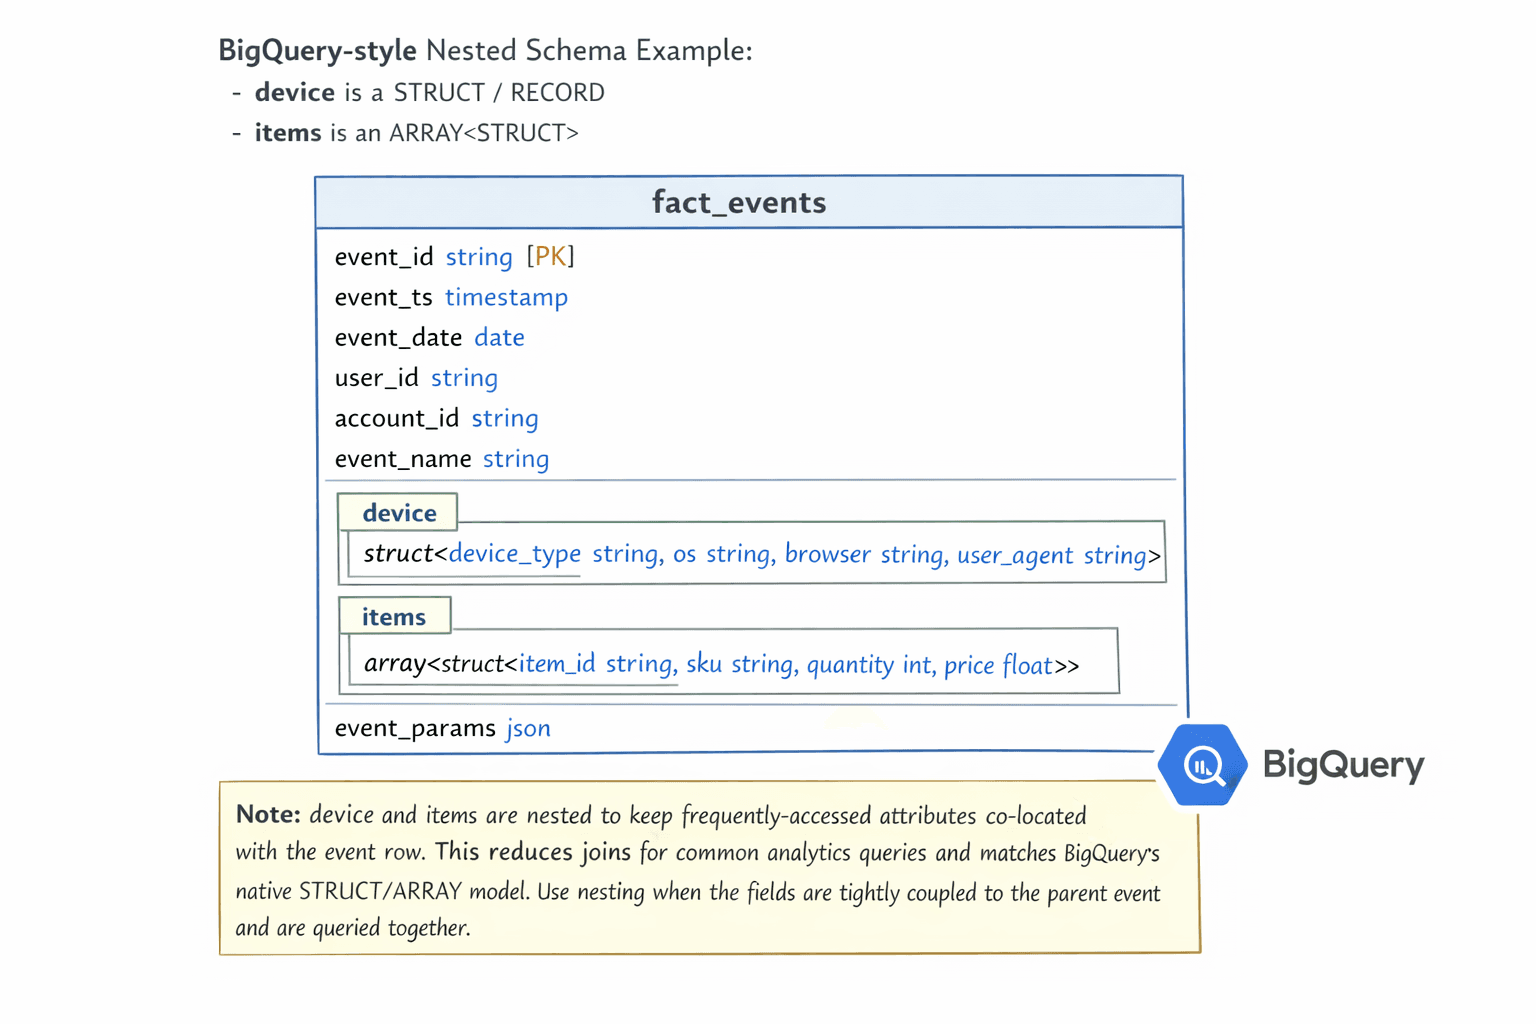
Decide when to use nested and repeated fields
BigQuery supports nested and repeated fields. Used well, they reduce joins and can make query patterns simpler.
Used badly, they create confusing query logic and messy data contracts.
ChartDB helps teams talk through nesting decisions with a visual model, so it is not just one engineer making a guess.
Plan partitioning and clustering strategies
Partitioning and clustering are your big levers for controlling scan size. In ChartDB, teams document those choices directly on the model so nobody has to dig through a random SQL file later.
Align schemas with real query patterns
Schema design should start from how data is queried, not how it arrives.
ChartDB helps teams write down query patterns and reflect them in the model. That usually leads to fewer surprises after launch.
Document schema decisions clearly for teams
The model becomes the shared reference. It is the “this is what we meant” artifact that actually survives onboarding, handoffs, and future refactors.
The simple idea is this: ChartDB helps teams think clearly before writing BigQuery SQL.
Step by step: Design in ChartDB, then implement in BigQuery
Note: This tutorial should be finalized after you run the flow end to end and capture the exact screenshots. I’m including clear placeholders so it is easy to swap in real visuals.
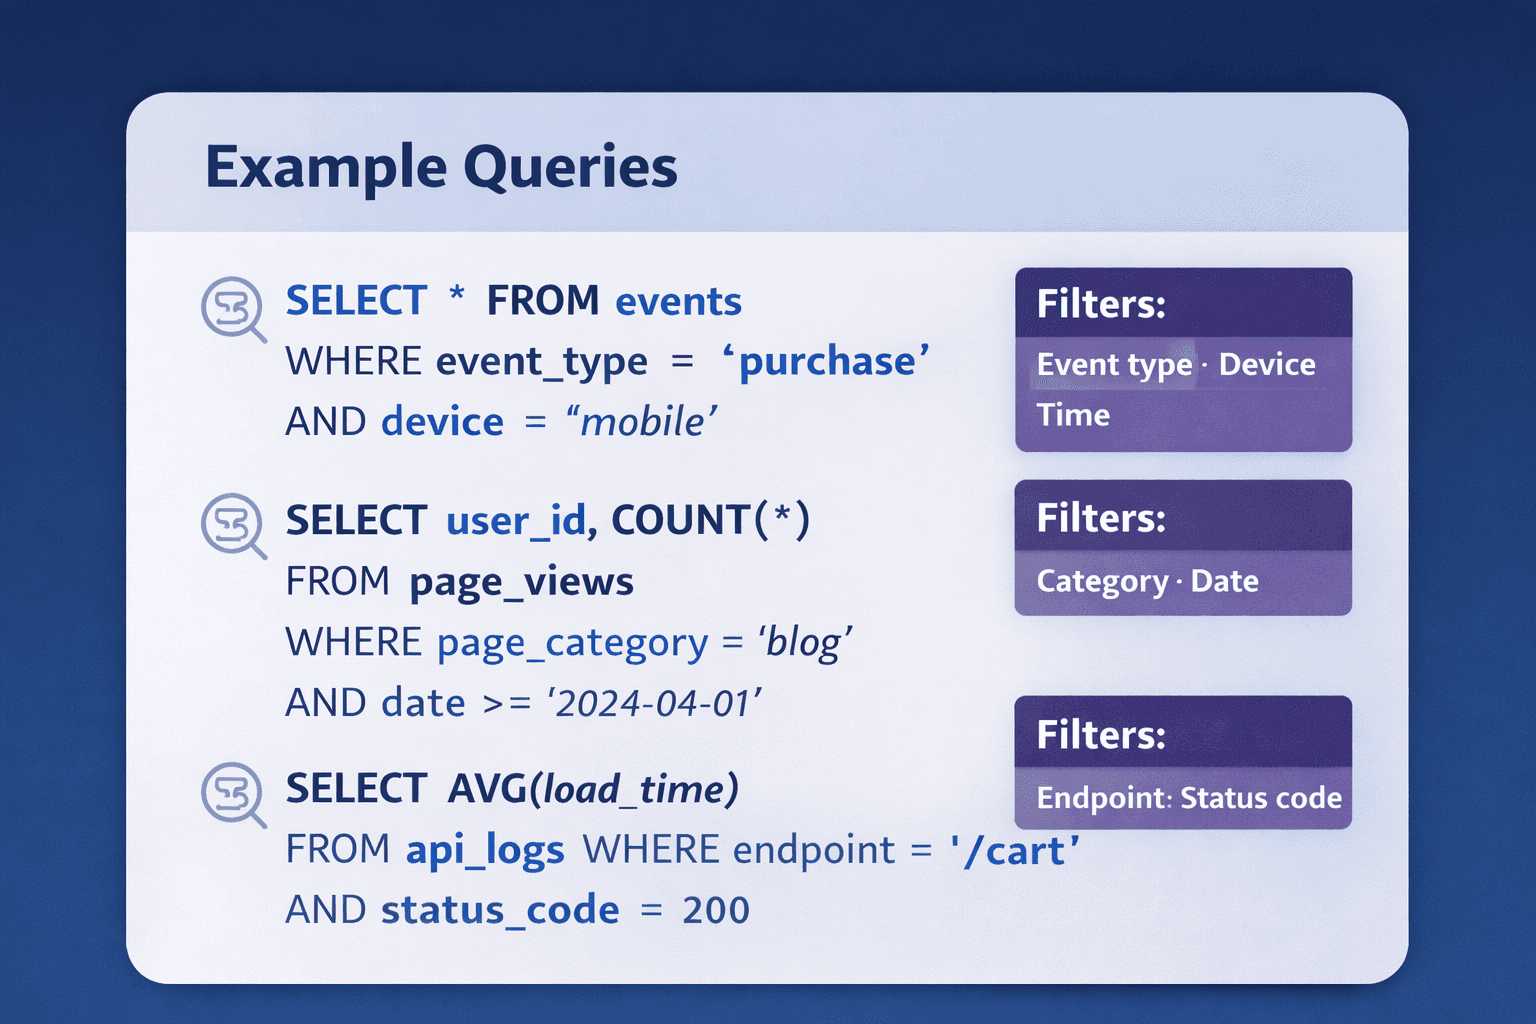
Step 1: Start with query patterns
Write down 5 to 10 of the queries your team will run constantly.
Think about:
Time based filters, like “last 7 days” or “last 90 days”
Group by dimensions, like plan, region, device type
Aggregations, like counts, sums, rolling windows
BigQuery schema design should start from how data is queried, not how it arrives from a pipeline.
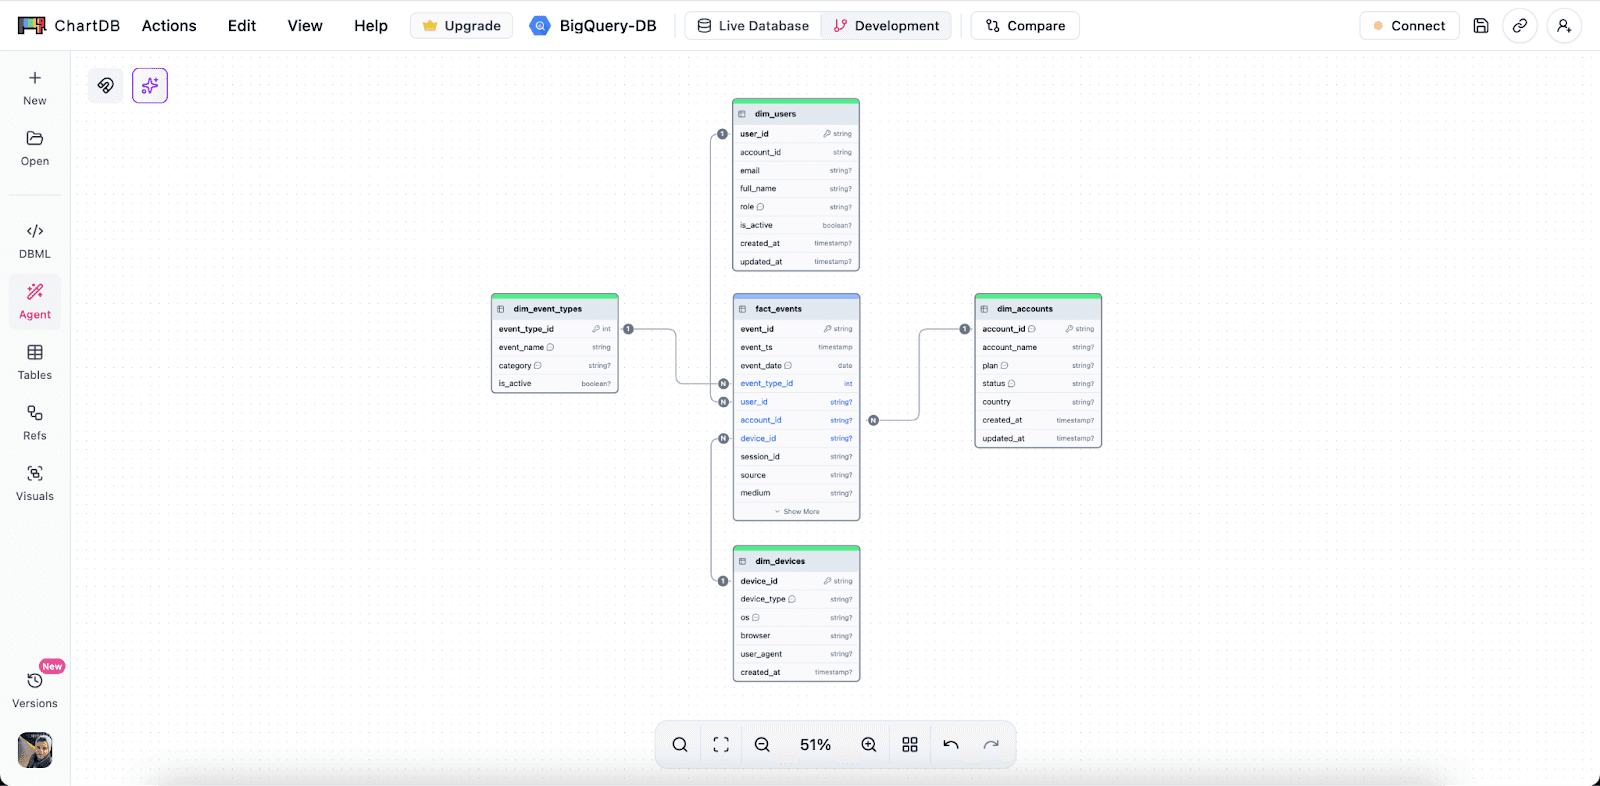
Step 2: Create core tables in ChartDB
Add your main fact tables first. For BigQuery, this is often events, logs, transactions, or sessions.
Then add supporting dimension tables only where they make sense. The goal is clarity, not a museum of tables.
Define fields and data types with intent. If a field is used for partitioning, mark it. If a field is commonly filtered, note it.
Step 3: Plan nested and repeated fields visually
Decide where nesting reduces joins and simplifies common queries.
Avoid unnecessary flattening that creates wide scans and duplicated attributes.
Document why nesting is used, so analysts do not have to reverse engineer intent later.
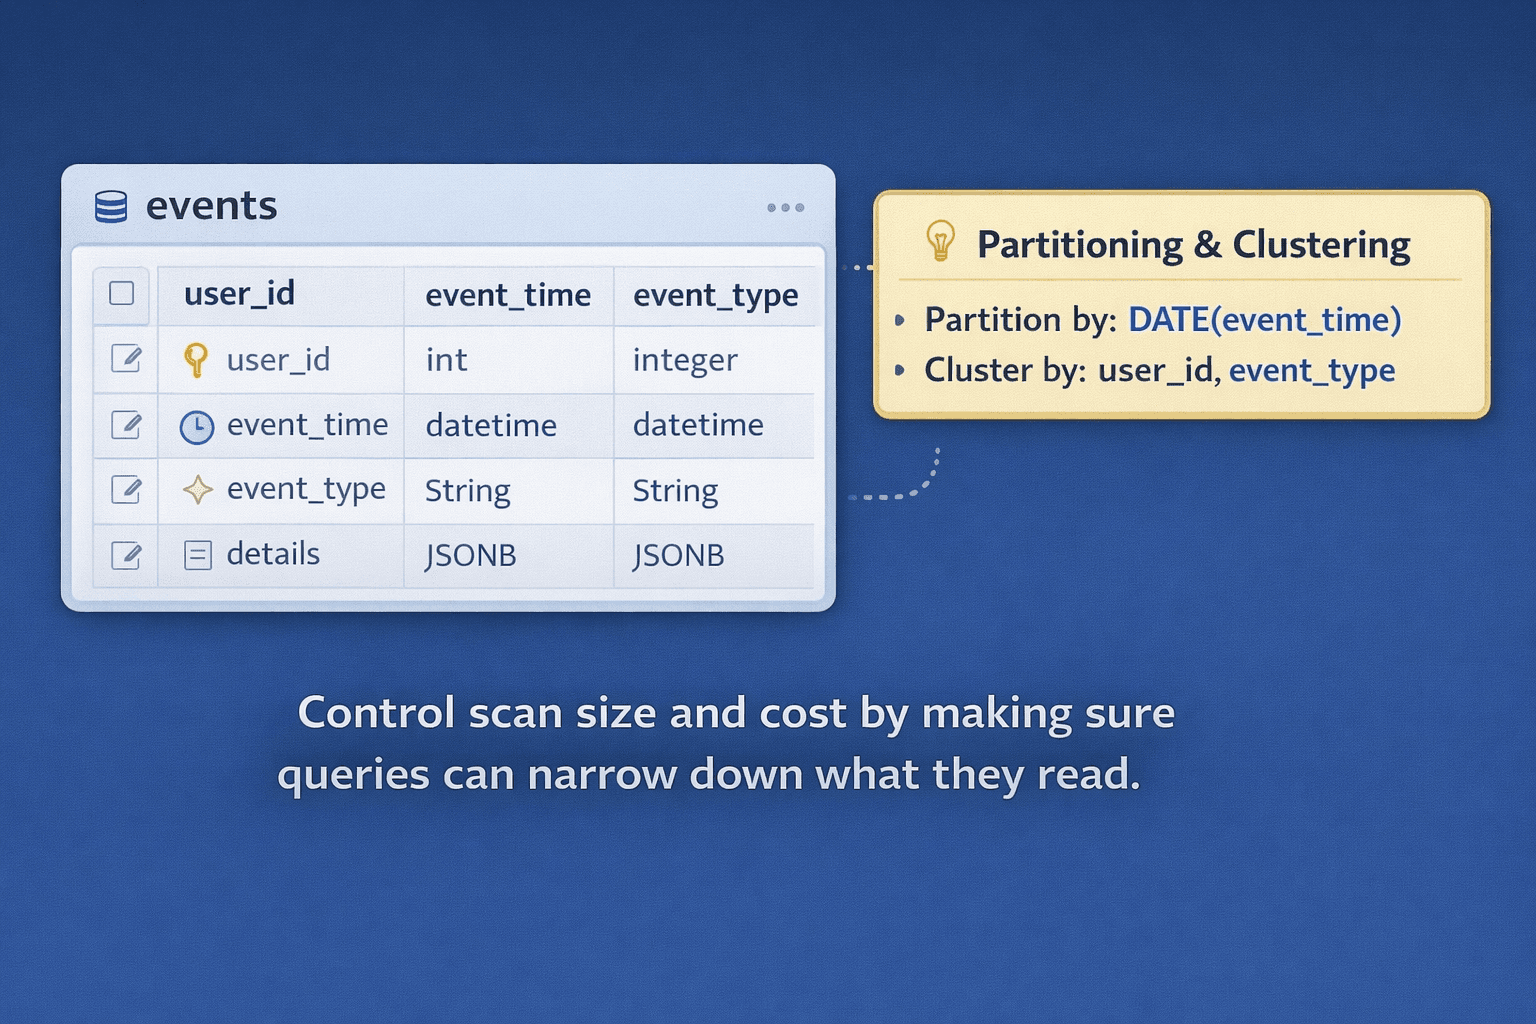
Step 4: Define partitioning and clustering decisions
Add clear notes in the diagram, for example:
Partition by: DATE(event_time)
Cluster by: user_id, event_type
The purpose is simple: control scan size and cost by making sure queries can narrow down what they read.
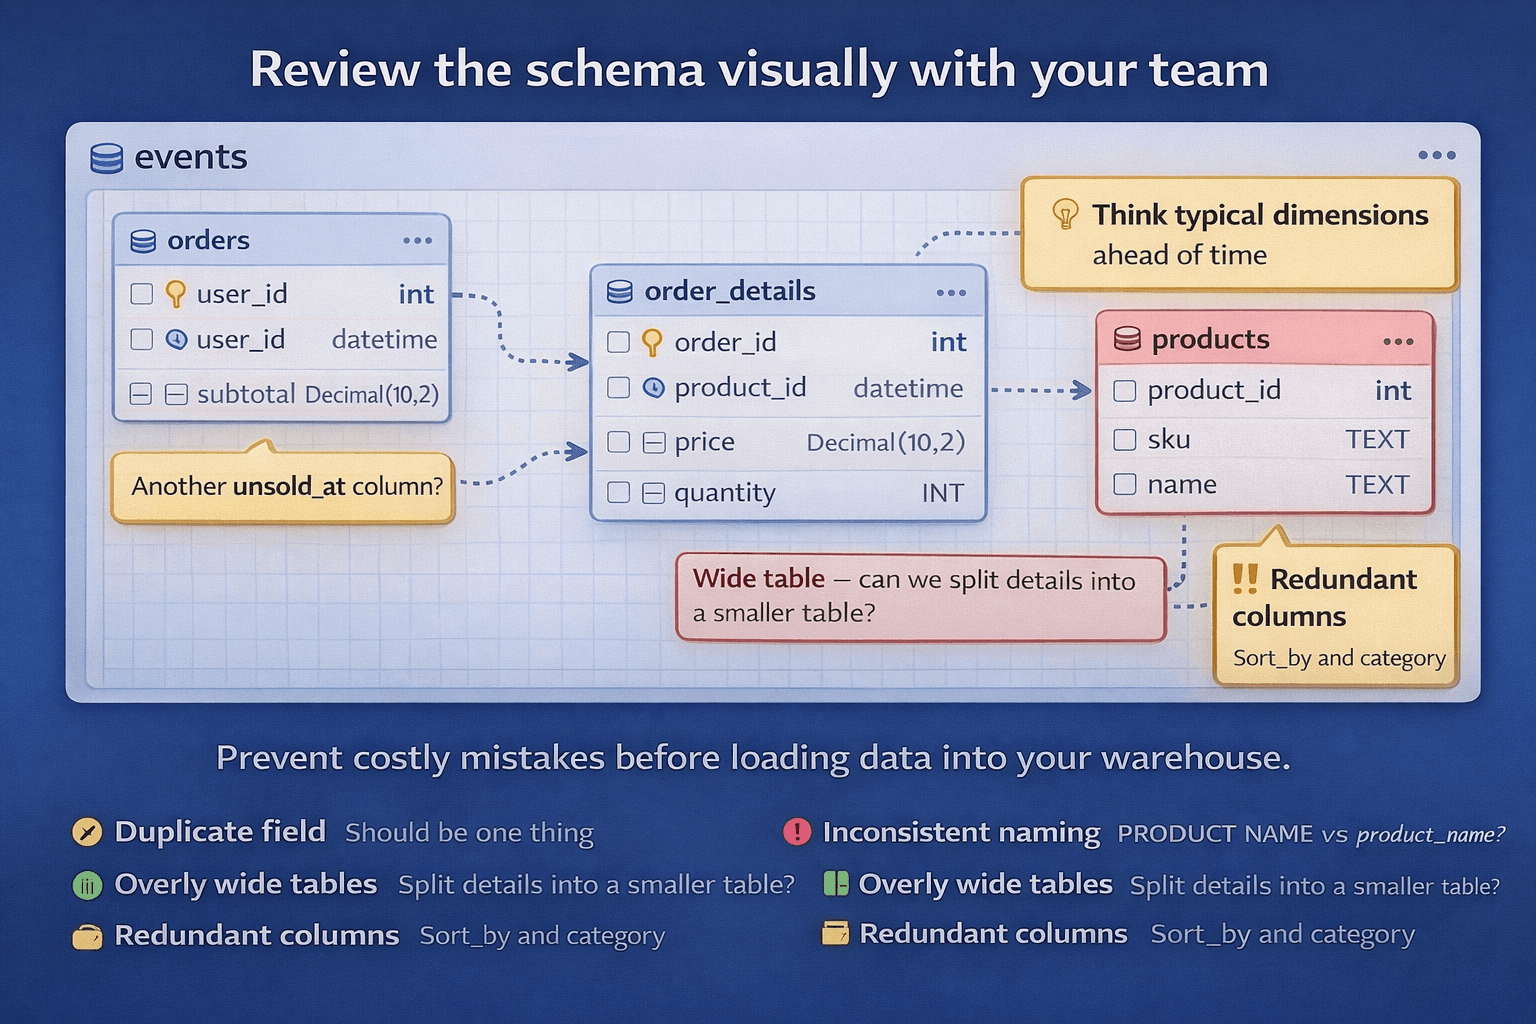
Step 5: Review the schema visually with the team
This is where you prevent expensive mistakes.
Review the model and look for:
Duplicate fields that should be one thing
Missing dimensions you know you will need later
Inconsistent naming that will annoy everyone
Overly wide tables that will become scan monsters
Align everyone before data is loaded. It is a lot easier to fix a diagram than to fix a loaded warehouse.
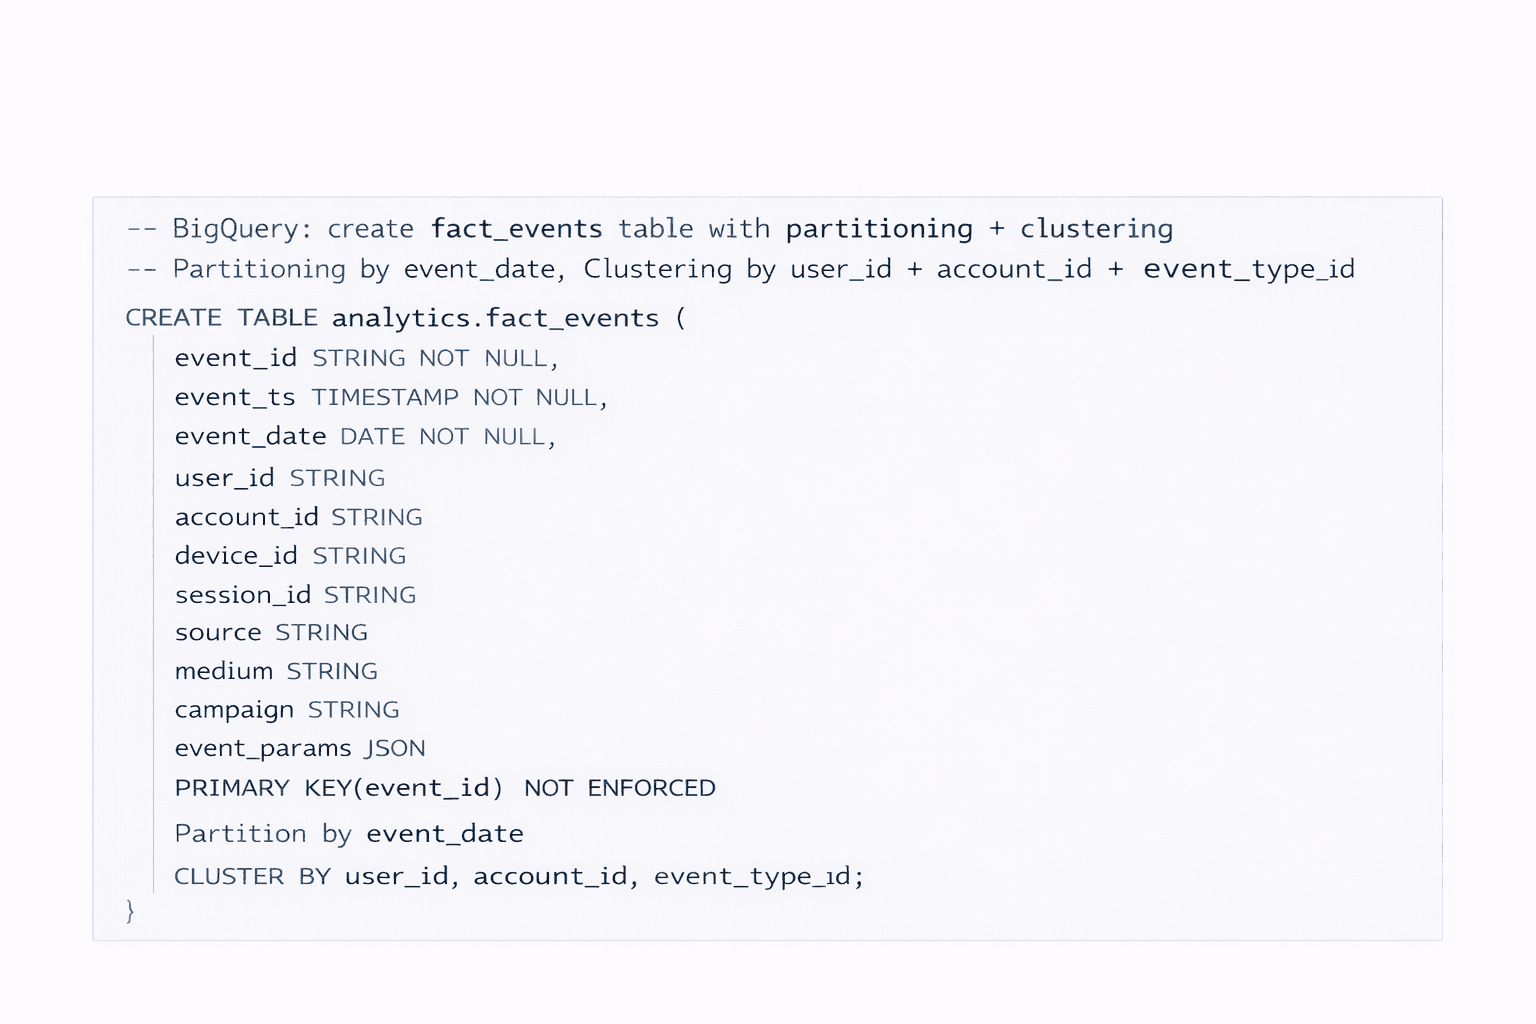
Step 6: Translate the approved schema into BigQuery SQL
Create the tables using the same structure.
Apply partitioning and clustering exactly as planned.
If you change these decisions in the SQL, update the diagram too. Otherwise you end up back in the “diagram is a lie” situation.
Step 7: Load data and validate against real queries
Run the original query list.
Check performance and cost. If something is scanning too much, adjust early, before data volume grows.
This is the point where BigQuery feels easiest to work with. Once the dataset is huge, fixes get slower, riskier, and more political.
Close the loop: designing schemas visually first leads to fewer rebuilds, less wasted compute, and more stable analytics as your warehouse grows.
Conclusion
BigQuery is an amazing serverless analytics platform. But it only stays fast and cost controlled when your schema is designed for analytics, not copied from OLTP habits.
Poor schemas do not usually break anything. They just create a quiet tax that grows with every dashboard and every new dataset.
ChartDB helps teams design and validate BigQuery schemas visually before writing SQL, so you can catch issues early and keep the model understandable as it evolves.
If you are building on BigQuery, try ChartDB and plan your schema the right way from day one.
More resources
Introduction
Google BigQuery is Google’s fully managed, serverless data warehouse. You throw data at it, run SQL on it, and it scales without you babysitting clusters or tuning a million knobs.
That is exactly why teams move to BigQuery. It’s fast, it’s easy to query at scale, and it removes a lot of infrastructure drama.
But here’s the part that surprises people the first time they get the bill.
BigQuery is powerful, but query speed and cost depend entirely on the data structure you give it. If your schema is sloppy, BigQuery will still run the query. It just quietly scans more than it needs to, costs more than it should, and eventually feels slower than you expected.
I’m Jonathan, co-founder of ChartDB. ChartDB helps teams design and visualize database schemas before writing SQL, so the model is clear, reviewable, and easy to share. In analytics systems like BigQuery, that planning step is not “nice to have.” It is how you keep performance predictable and costs under control.
In this guide, I’ll cover:
Why schema design is critical in BigQuery
What goes wrong when schemas are designed poorly
How ChartDB helps teams plan efficient BigQuery models before they ever load data
[IMAGE: A simple before and after graphic. Left shows a messy wide table and a pricey query. Right shows partitioned and clustered schema with a cheaper query.]
Why Schema Design Is So Critical in BigQuery
BigQuery schemas are not just column definitions. They are the difference between “this dashboard loads instantly” and “why did this query scan 2 TB.”
BigQuery charges based on data scanned
BigQuery’s pricing model makes schema design feel very real. When a query scans more bytes, it costs more. That means your goal is not only to make queries correct. Your goal is to make them selective.
In practice, that means you want queries to read the smallest possible slice of data.
Flat, wide tables can explode query costs
Wide, flattened tables are tempting. They feel simple. One table, one query, done.
The catch is that wide tables often lead to wide scans. If analysts keep selecting many columns or filtering poorly, your scans balloon. Over time, “simple” becomes “expensive.”
Poor partitioning leads to full table scans
If you have time based data and you do not partition it, BigQuery can end up scanning far more than you think, even for “last 7 days” questions.
Partitioning is your first line of defense against accidental full table scans.
Incorrect data types increase storage and scan size
Data types are not just correctness. They impact storage and query efficiency.
A classic example is using STRING for fields that should be INT or DATE. It works, until it makes everything heavier. More bytes stored, more bytes scanned.
Joins across large tables quickly become expensive
BigQuery can do joins, but it rewards smart modeling.
If you are constantly joining massive fact tables to big dimensions with poor filters, cost and performance can drift in a way that is hard to notice until it is bad.
A key difference from OLTP databases
BigQuery is optimized for analytics, not transactions.
If you model BigQuery like MySQL or Postgres, fully normalized, lots of small tables, heavy joins for every question, you often create pain for analysts and cost for the business.
And here is the sneaky part.
In BigQuery, bad schema design usually does not break queries. It silently increases cost and slows everything down.
How ChartDB Helps You Create BigQuery Schemas Faster and Safer
ChartDB is not BigQuery itself. It does not run your warehouse workloads.
ChartDB sits before BigQuery. It is a planning and visualization layer that helps teams think clearly about structure, relationships, and query patterns before they commit to SQL and ingestion.
Here is what teams use ChartDB for when working on BigQuery.
Design BigQuery table structures visually
Instead of staring at raw SQL, you can map out your fact tables and dimensions as a diagram. For teams, this matters because schema design is often a group decision, even if one person writes the final CREATE TABLE.
Decide when to use nested and repeated fields
BigQuery supports nested and repeated fields. Used well, they reduce joins and can make query patterns simpler.
Used badly, they create confusing query logic and messy data contracts.
ChartDB helps teams talk through nesting decisions with a visual model, so it is not just one engineer making a guess.
Plan partitioning and clustering strategies
Partitioning and clustering are your big levers for controlling scan size. In ChartDB, teams document those choices directly on the model so nobody has to dig through a random SQL file later.
Align schemas with real query patterns
Schema design should start from how data is queried, not how it arrives.
ChartDB helps teams write down query patterns and reflect them in the model. That usually leads to fewer surprises after launch.
Document schema decisions clearly for teams
The model becomes the shared reference. It is the “this is what we meant” artifact that actually survives onboarding, handoffs, and future refactors.
The simple idea is this: ChartDB helps teams think clearly before writing BigQuery SQL.
Step by step: Design in ChartDB, then implement in BigQuery
Note: This tutorial should be finalized after you run the flow end to end and capture the exact screenshots. I’m including clear placeholders so it is easy to swap in real visuals.
Step 1: Start with query patterns
Write down 5 to 10 of the queries your team will run constantly.
Think about:
Time based filters, like “last 7 days” or “last 90 days”
Group by dimensions, like plan, region, device type
Aggregations, like counts, sums, rolling windows
BigQuery schema design should start from how data is queried, not how it arrives from a pipeline.
Step 2: Create core tables in ChartDB
Add your main fact tables first. For BigQuery, this is often events, logs, transactions, or sessions.
Then add supporting dimension tables only where they make sense. The goal is clarity, not a museum of tables.
Define fields and data types with intent. If a field is used for partitioning, mark it. If a field is commonly filtered, note it.
Step 3: Plan nested and repeated fields visually
Decide where nesting reduces joins and simplifies common queries.
Avoid unnecessary flattening that creates wide scans and duplicated attributes.
Document why nesting is used, so analysts do not have to reverse engineer intent later.
Step 4: Define partitioning and clustering decisions
Add clear notes in the diagram, for example:
Partition by: DATE(event_time)
Cluster by: user_id, event_type
The purpose is simple: control scan size and cost by making sure queries can narrow down what they read.
Step 5: Review the schema visually with the team
This is where you prevent expensive mistakes.
Review the model and look for:
Duplicate fields that should be one thing
Missing dimensions you know you will need later
Inconsistent naming that will annoy everyone
Overly wide tables that will become scan monsters
Align everyone before data is loaded. It is a lot easier to fix a diagram than to fix a loaded warehouse.
Step 6: Translate the approved schema into BigQuery SQL
Create the tables using the same structure.
Apply partitioning and clustering exactly as planned.
If you change these decisions in the SQL, update the diagram too. Otherwise you end up back in the “diagram is a lie” situation.
Step 7: Load data and validate against real queries
Run the original query list.
Check performance and cost. If something is scanning too much, adjust early, before data volume grows.
This is the point where BigQuery feels easiest to work with. Once the dataset is huge, fixes get slower, riskier, and more political.
Close the loop: designing schemas visually first leads to fewer rebuilds, less wasted compute, and more stable analytics as your warehouse grows.
Conclusion
BigQuery is an amazing serverless analytics platform. But it only stays fast and cost controlled when your schema is designed for analytics, not copied from OLTP habits.
Poor schemas do not usually break anything. They just create a quiet tax that grows with every dashboard and every new dataset.
ChartDB helps teams design and validate BigQuery schemas visually before writing SQL, so you can catch issues early and keep the model understandable as it evolves.
If you are building on BigQuery, try ChartDB and plan your schema the right way from day one.
More resources

Continue Reading


© 2026 ChartDB
Product
Free Tools
© 2025 ChartDB
Product
Free Tools
© 2025 ChartDB