


Mission
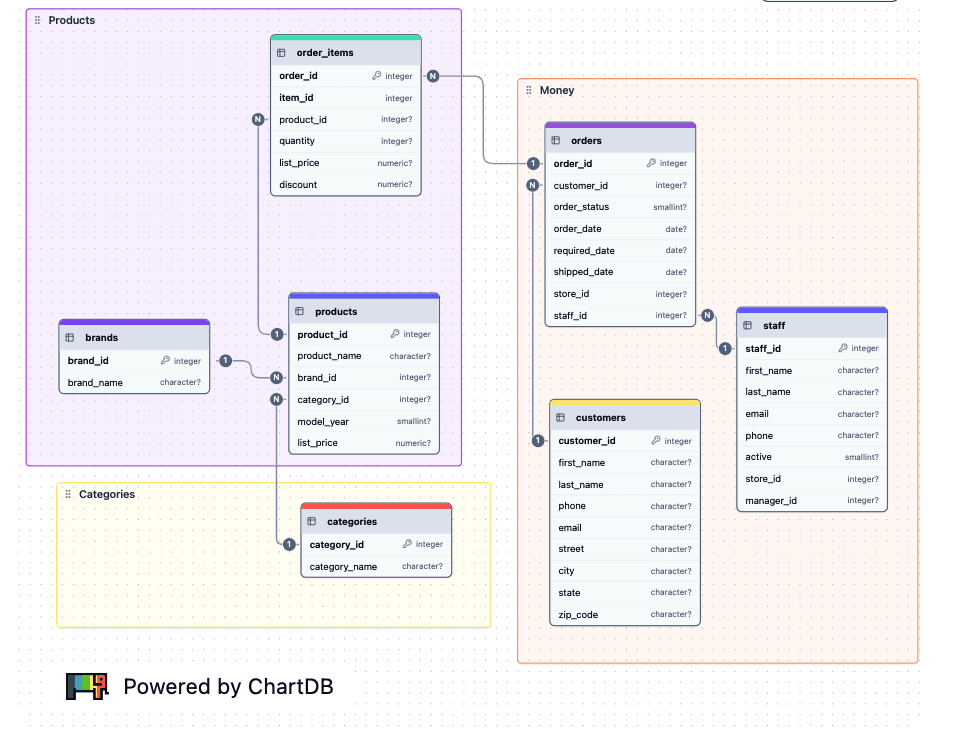
We want everyone to see what's in their database without any hassle. Our goal is to turn confusing schemas into easy, shareable diagrams, so teams can work faster and understand their data right away.
What Sparked the Idea
Founded in 2024
We're two long-time friends and collaborators, both developers, both obsessed with making better tools for engineers.
The idea for ChartDB came from a recurring pain we both experienced firsthand: every time we joined a new project or revisited an old one, understanding the database schema was a slow, frustrating process. Diagrams were outdated (if they even existed), and existing tools felt heavy, clunky, or required full access to the production database, which wasn't always possible or safe.
In August 2024, we decided to build it. In less than 3 weeks, we launched an MVP as an open-source project. The response blew us away. Within days, ChartDB hit the front page of Hacker News, gained thousands of stars on GitHub, and attracted a fast-growing community of developers who shared the same pain.
That early traction validated the idea: database visualization shouldn't be a chore. It should be instant, accurate, and collaborative, for developers, analysts, and even product teams. We've been building ever since.