
Dec 3, 2025
Dbdiagram vs Drawsql vs ChartDB: Picking The Best Tool To Visualize Your Database
Dbdiagram vs Drawsql vs ChartDB: Picking The Best Tool To Visualize Your Database
Dbdiagram vs Drawsql vs ChartDB: Picking The Best Tool To Visualize Your Database
Discover how Dbdiagram, DrawSQL, and ChartDB stack up in real-world use. Learn which tool offers the best blend of design, collaboration, and AI to help teams model and scale data systems effectively.
Discover how Dbdiagram, DrawSQL, and ChartDB stack up in real-world use. Learn which tool offers the best blend of design, collaboration, and AI to help teams model and scale data systems effectively.
Discover how Dbdiagram, DrawSQL, and ChartDB stack up in real-world use. Learn which tool offers the best blend of design, collaboration, and AI to help teams model and scale data systems effectively.

Jonathan Fishner
12 minutes read
A while ago I was trying to explain a pretty simple question to a teammate:
“This customer_id here… where does it actually come from?”
Five minutes later I had three tabs open, a migration folder, an old Confluence page, and zero clarity. At that point it does not matter how clean your SQL is. If you cannot see the schema, you are guessing.
That is where tools like Dbdiagram, DrawSQL, and ChartDB come in. They all promise the same thing on paper: “visualize your database.”
But they feel very different when you sit down, open a browser, and try to model a real system.
I am Jonathan, founder of ChartDB. I have been living in ERDs and database tooling for years, both as an engineer and now as a founder. For this comparison, I did something simple and honest:
I created the same small SaaS schema in all three tools:
users
teams
projects
subscriptions
Then I paid attention to what felt smooth, what got in the way, and where each tool shines. You can absolutely recreate the same test yourself, and if you want to publish this on the ChartDB blog you can drop in screenshots from all three tools.
This is not meant to trash anyone. Dbdiagram and DrawSQL are good products. The point is to help you pick the right tool for your team.
How I’m Comparing Them (Without Overthinking It)
I did not want a 40 row spreadsheet that nobody reads. So I stuck to the things that actually matter when you are working with real databases:
Can it import or sync from an existing database?
Which databases and formats does it speak well?
How does collaboration feel in practice?
Can I share or embed diagrams easily?
What does export look like when I need SQL or an image?
Any real AI capabilities or just buzzwords?
Does it die when you throw a big schema at it?
Are there templates or examples so I do not start from a blank canvas?
Any integrations that actually save time?
What are the hosting and security options?
How painful or friendly is the pricing?
And finally, do the people behind it seem to care?
Keep these in the back of your head while you read through each tool. You will probably feel which one fits your style.
Dbdiagram
What Dbdiagram Is Trying To Be (dbdiagram)
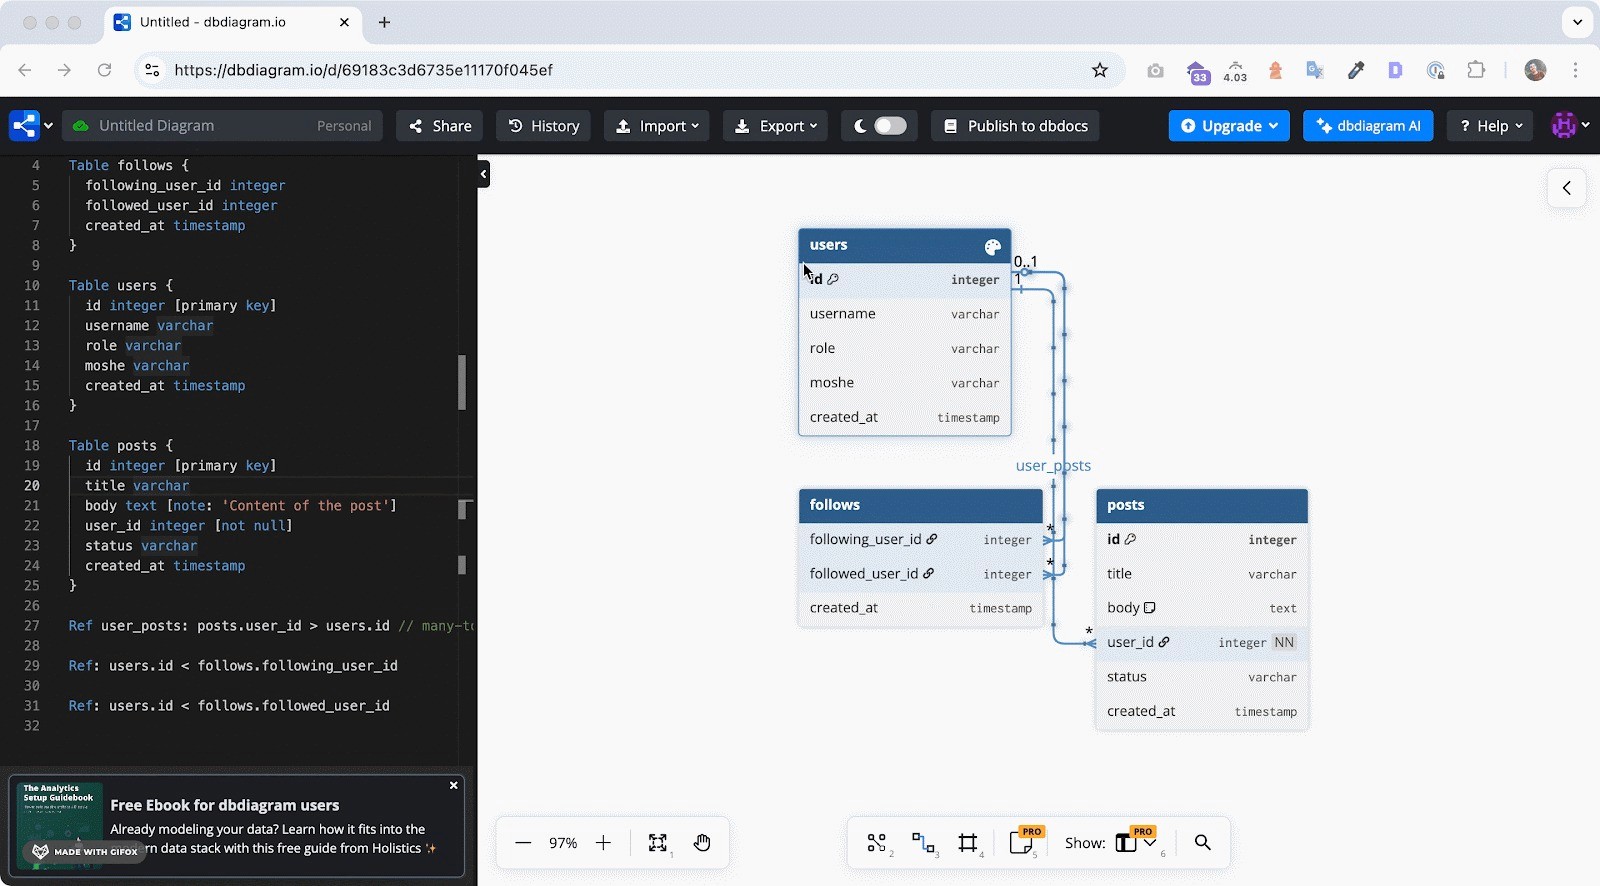
Dbdiagram.io is for developers who like text more than drag and drop. Instead of placing tables on a canvas, you describe your schema using DBML or SQL, and Dbdiagram turns that into a visual ERD.
It feels a bit like writing code and getting a diagram as a side effect. Which is pretty nice if that is how your brain works.
For this test, I wrote the SaaS schema in DBML and watched the diagram appear almost instantly. Clean, minimal, and familiar.
How It Handles The Important Stuff (dbdiagram)
Import and sync
You can paste SQL or DBML and get a diagram. There is no “live connection” to a running database that keeps things in sync, so Dbdiagram is better for design and documentation than continuous introspection.
Supported databases
It covers the usual suspects: Postgres, MySQL, SQL Server, and friends. If you are living in classic relational land, you are fine.
Collaboration and sharing
You can share diagrams with links and invite collaborators. It works, especially for smaller teams. It is not trying to be a full blown collaborative workspace.
Sharing and embeds
Most people export an image and paste it into Notion, Confluence, or a pull request. It is pretty stock, but it gets the job done.
Export options
You get SQL exports in different dialects, plus images. That is usually enough for reviews and migrations.
AI capabilities
Right now, Dbdiagram is not really an AI first tool. You do the thinking, you write the structure, it draws what you tell it to.
Performance with larger schemas
It feels good on small and medium diagrams. Once you hit a bigger schema with lots of tables, things can get visually dense. You need to be disciplined with layout.
Templates and examples
There are some examples and community snippets. Helpful if you need a starting point or want to see how others structure their DBML.
Integrations, hosting, security
It runs as a hosted SaaS. No self hosted open source version. If you have strict data residency needs, keep that in mind.
Pricing in Real Terms (dbdiagram)
There is a free tier that is genuinely useful for individuals and small projects. Once you want more private diagrams, more projects, and team usage, you move into paid plans.
That is usually how teams use it:
Start free
Hit the limits
Upgrade once it becomes annoying
Nothing shocking here.
Who Dbdiagram is great for:
Developers who prefer writing schemas in text, like DBML or SQL, and want a quick visual representation without a lot of ceremony.
DrawSQL
What DrawSQL Is Going For (DrawSQL)
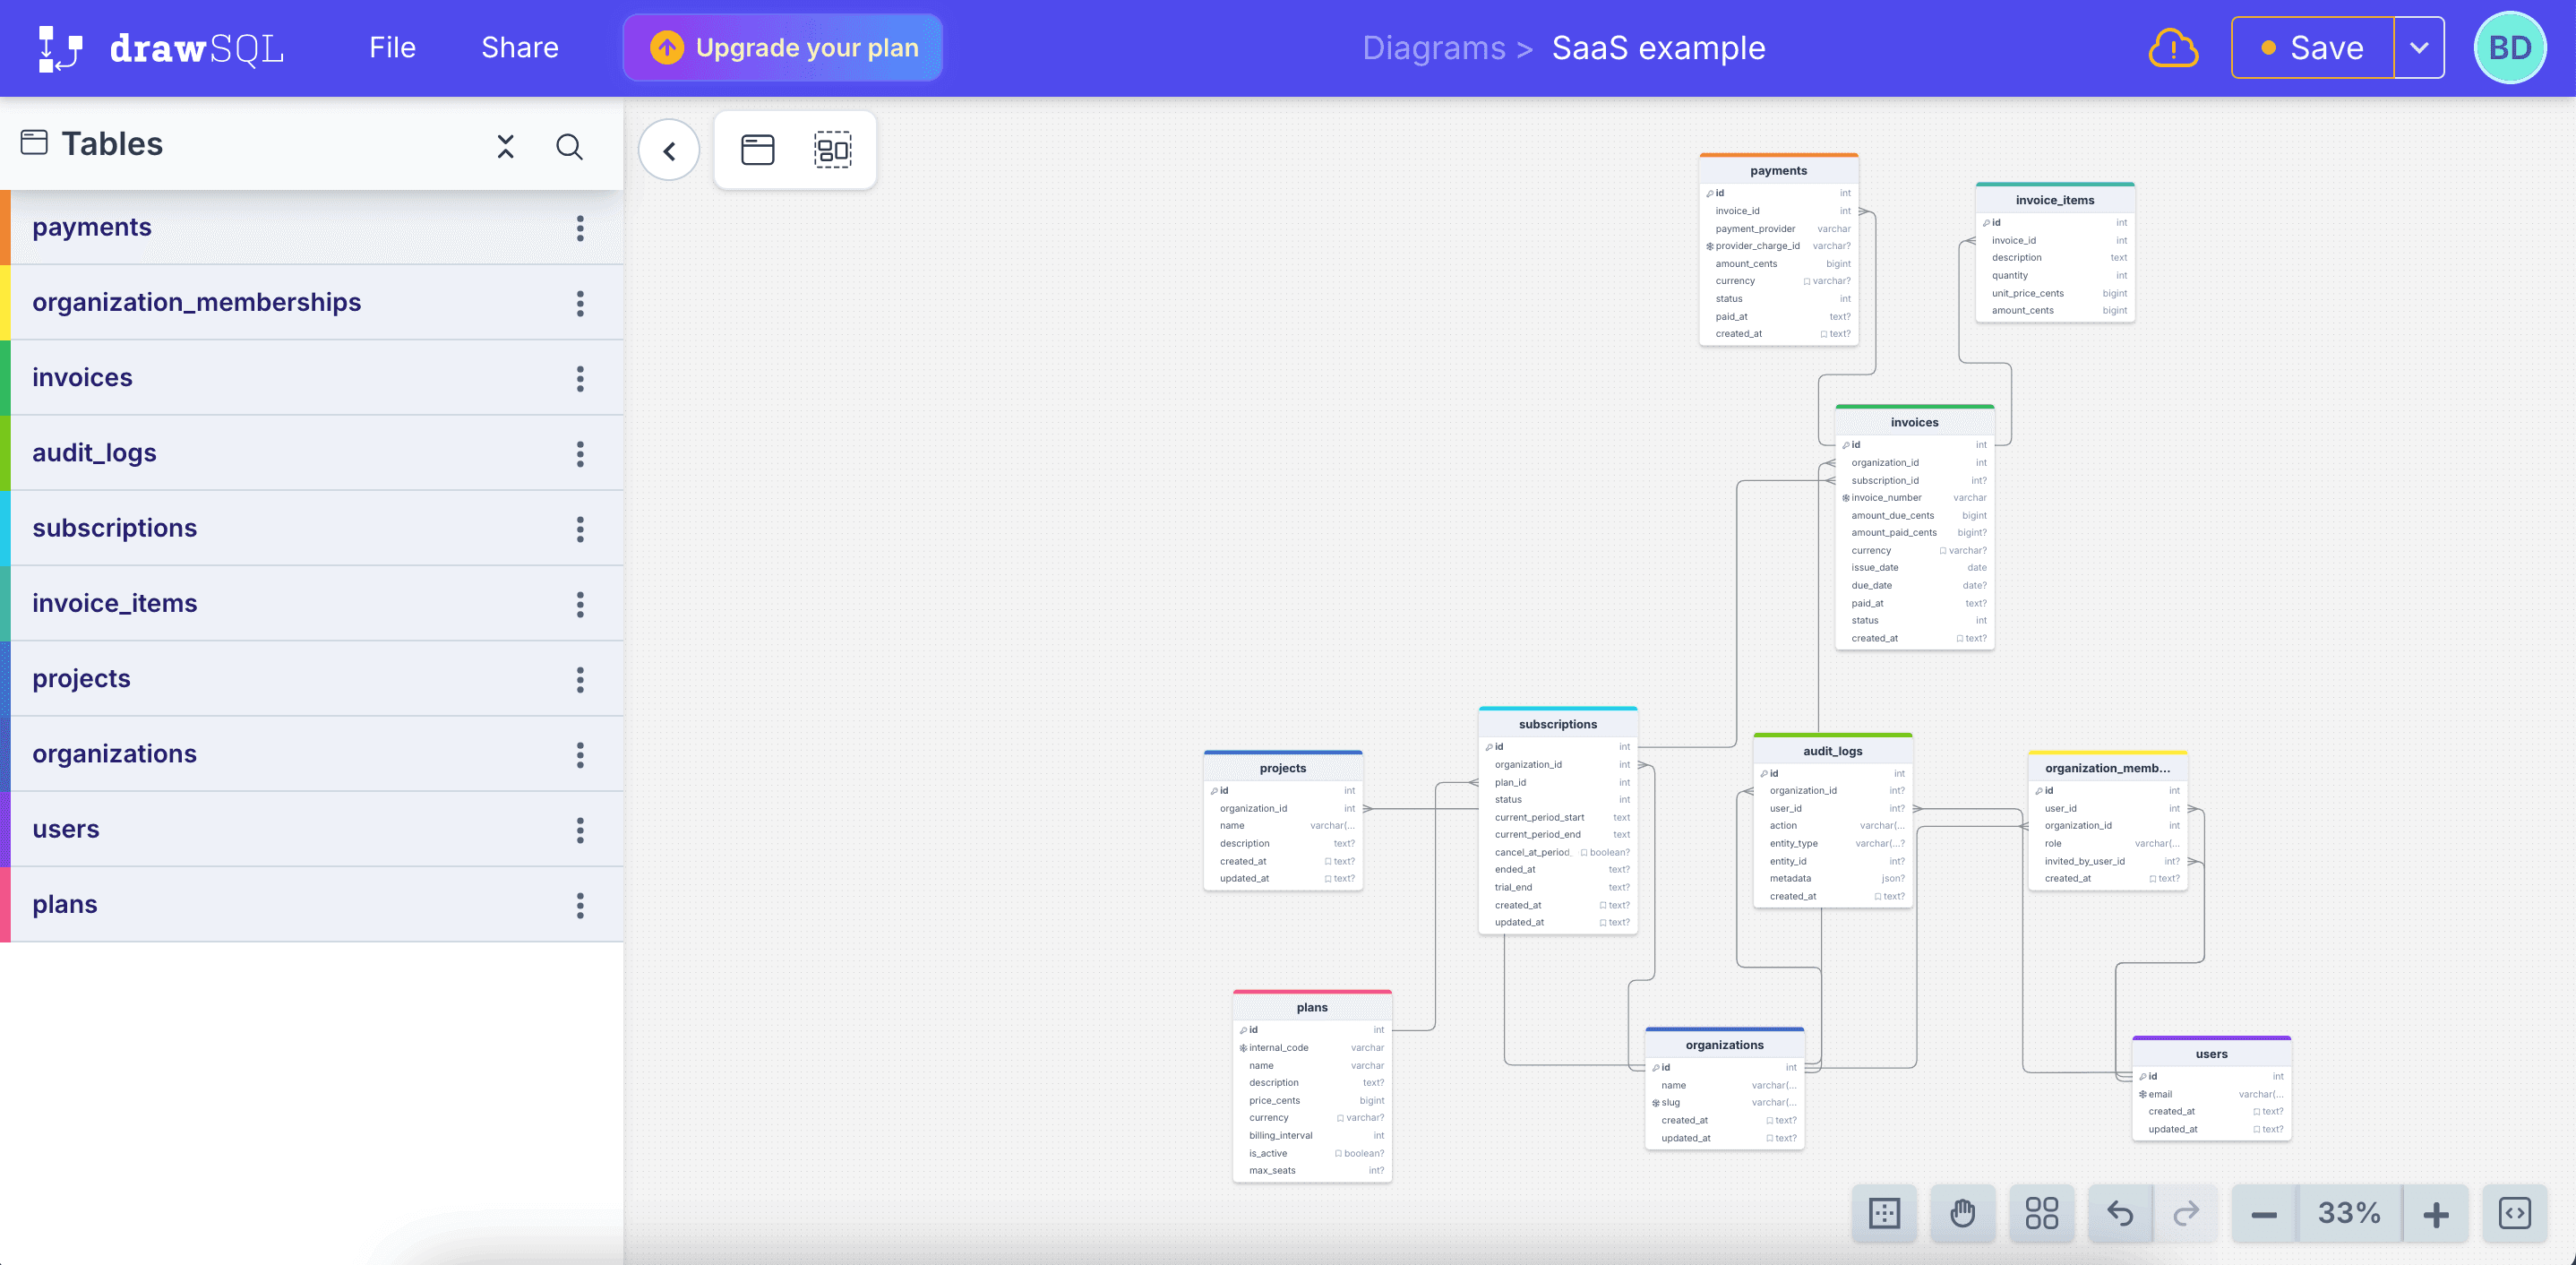
DrawSQL feels like Dbdiagram’s more visual cousin. It is very much “ERDs as a product,” with a modern interface, nice colors, and a focus on collaboration.
Instead of writing everything as code, you drag tables around, define relationships in a panel, and polish the diagram until it looks like something you could show to a non engineer.
For this comparison, I recreated the same SaaS schema visually in DrawSQL. It looked good. The canvas feels modern and friendly.
How It Handles The Important Stuff (DrawSQL)
Import and sync
DrawSQL lets you import SQL, which is handy when you do not want to start from scratch. It is still not a live sync engine, so if your database changes, you need to re import or adjust things manually.
Supported databases
Supports popular relational databases. If your team primarily uses Postgres, MySQL, or SQL Server, you are covered.
Collaboration
This is where DrawSQL leans hard. Multiple people can work on the same diagram, and it really feels like a shared design space. Great for schema reviews and planning sessions.
Sharing and embeds
You can share links, and there are options to embed diagrams where you need them. If your team likes to see diagrams inside dashboards or documentation, this is a big plus.
Export options
DrawSQL exports SQL, PNG, PDF, and more. So if you need to slap an ERD into a spec or slide deck, it is easy.
AI capabilities
As of now, DrawSQL does not really feel like an AI powered tool. It is more like a very nice manual editor with collaboration on top.
Performance with larger schemas
It can handle reasonably large schemas, but like any fully visual editor, big diagrams require careful organization. If you throw 150 tables at it in one view, things will get tight.
Templates and examples
The template library is honestly one of the nicest things about DrawSQL. You can browse existing schemas, clone them, and adjust. Very useful for “I know this pattern exists, just show me something close.”
Integrations, hosting, security
Hosted SaaS only. No open source self hosted build. So again, fine for many teams, less ideal if you are strict about where your database structure lives.
Pricing in Real Terms (DrawSQL)
You get a free or hobby tier with limits on tables and diagrams. Then a couple of tiers that add more diagrams, more tables, and more users.
Roughly:
Individuals and hobby projects: stick to free or the lowest paid tier
Small to mid teams: end up on the mid tier
Larger teams: go to the team or business tier to remove friction
If you like the product, paying for it usually feels reasonable because you are using it heavily in your workflow.
Who DrawSQL is great for:
Teams who want pretty, collaborative ERDs that feel good to work in, and who do not mind doing most of the modeling work by hand.
ChartDB
What We’re Building With ChartDB
ChartDB is the one I am biased about, obviously. I built it because I was frustrated with the gap between:
“I have a real database with 80 tables and weird history”
and“I want a clean ERD that I can actually reason about.”
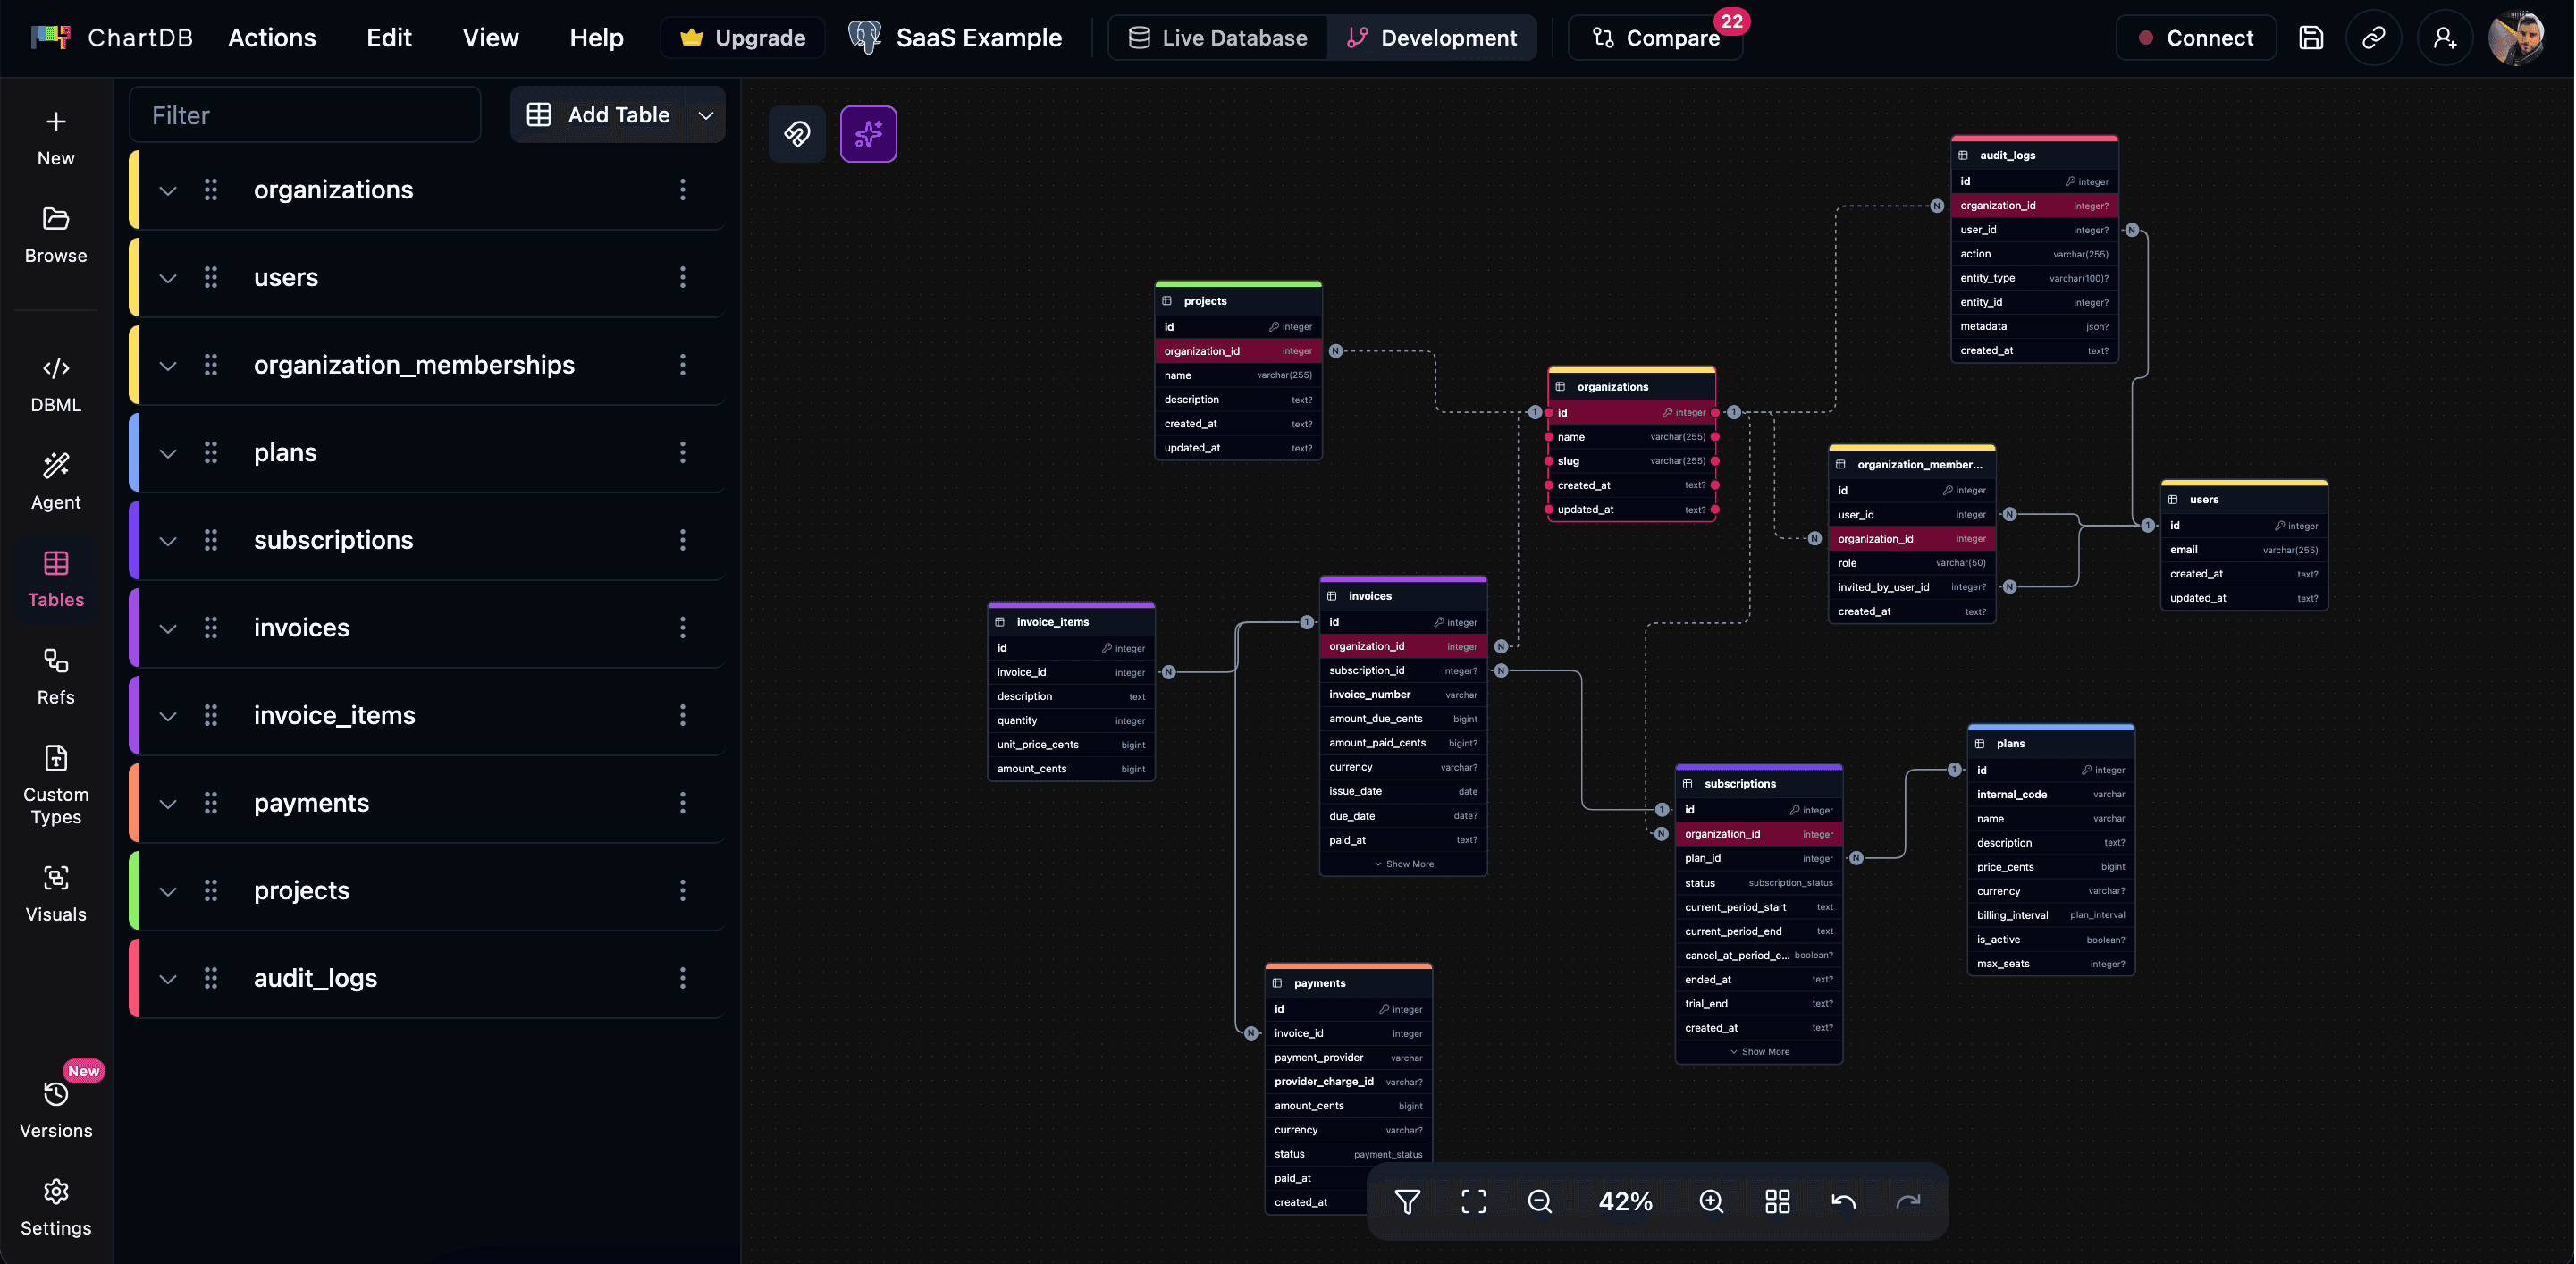
ChartDB is a modern ERD and database visualization tool that is designed to be:
friendly for developers
powerful enough for big schemas
and actually helped by AI, not just marketing copy
The core idea is simple. You connect your database or paste SQL, and ChartDB gives you a live, navigable diagram. Then you can let the AI Agent help with the boring parts.
For this comparison, I took the same SaaS idea, gave the AI Agent a short prompt, and got an initial schema. From there I moved some tables, added colors for domains, and tightened the relationships. It felt like pairing with a smart assistant, not starting from a blank canvas.
How It Handles The Important Stuff (ChartDB)
Import and sync
You can:
connect to real databases (Postgres, MySQL, SQL Server, SQLite, MariaDB, more over time)
import SQL dumps
or even generate a schema from scratch with AI
ChartDB is built to understand real schemas that already exist, not just toy examples.
Supported databases
Focused on relational databases, but across multiple engines. If you live in SQL land, it is a good fit.
Collaboration
You can invite teammates, share read-only links, and use ChartDB for planning sessions or reviews. It is definitely built with teams in mind, not just solo architects.
Sharing and embeds
You can share diagrams with stakeholders, embed them where you need them, and use them as a living map of your system rather than a one off export.
Export options
ChartDB gives you:
SQL and DDL exports in multiple dialects
image exports for docs and decks
Plenty to plug into migrations or internal documentation.
AI capabilities
This is the big one.
With the AI Agent you can:
Generate an ERD from a simple text description (for example, “multi tenant SaaS with users, orgs, projects, subscriptions, and audit logs”)
Ask it to add timestamps or soft deletes across all tables
Let it suggest foreign keys you missed
Clean up naming and group tables by domain
It does not replace thinking, but it cuts down a lot of repetitive work and gives you a second brain when you are cleaning up existing databases.
Performance with large schemas
ChartDB is wired to handle big schemas. Domain based colors, areas, zooming, filtering. You can actually work with large diagrams without wanting to close the tab.
Templates and examples
You can use templates, or just rely on the AI to create a solid first draft. Personally, I often type what I would write in a spec and let it turn that into tables and relationships.
Integrations, hosting, security
There is a hosted cloud version if you want the easy path. There is also an open source, self hosted option for teams that need more control or want it inside their own network.
That open source piece matters for a lot of engineering teams. You do not always want your entire schema living in someone else's SaaS.
Pricing in Real Terms (ChartDB)
There is a free plan that is genuinely useful. You can try it with your real database, not just a toy example.
Paid tiers unlock:
more diagrams
more AI usage
team collaboration features
Most teams I talk to start free, then upgrade once ChartDB becomes part of their weekly workflow.
Who ChartDB is great for:
Engineering and data teams that want an ERD tool that can handle real life schemas, make use of AI for the repetitive parts, and still feel fast and modern.
Quick Comparison Table
Here is a simple view you can drop into the blog so people can skim.
Feature | Dbdiagram | DrawSQL | ChartDB |
Main style | Text first | Visual first | Visual plus AI |
Input | DBML, SQL | Visual editor, SQL import | SQL, live DB, natural language |
Live DB friendly | Not really | Not really | Yes, built for it |
AI for ERDs | No | Very limited or none | Yes, core part of the product |
Collaboration | Basic sharing | Strong real time collaboration | Team friendly, built for reviews |
Templates | Some examples | Rich template library | Templates plus AI generated starters |
Export | SQL, images | SQL, images, PDF | SQL, DDL, images |
Self hosted option | No | No | Yes, open source core |
Best fit | Devs who like code based ERDs | Teams who want pretty, visual ERDs | Teams who want AI, scale, and modern UX |
You can tweak this table with whatever details you care about most.
So… Which One Should You Actually Use?
If you are still reading, you probably want a straight answer.
Here is how I would think about it if I were in your shoes.
If you love writing schemas in text, and just want a clean diagram from DBML or SQL, Dbdiagram is a nice, simple option. Low friction, easy to learn, and very developer centric.
If you want polished, shareable diagrams and your team loves working visually together, DrawSQL gives you a very pleasant experience. Especially good for architecture reviews, spec documents, and anything that needs to look nice.
If your reality is bigger schemas, multiple databases, legacy structure that needs cleaning, and you like the idea of pairing with an AI assistant while you design and document, ChartDB is probably the best long term fit.
Dbdiagram and DrawSQL both do what they claim, and I would genuinely recommend them in the right context.
The reason I am betting my time and energy on ChartDB is that the job has changed. We are not only drawing ERDs for slides anymore. We are keeping real systems understandable while they grow like crazy, and we finally have AI that can help with that.
If you are curious how that feels in practice, do the same test I did:
Take one schema or idea
Build it in Dbdiagram
Build it in DrawSQL
Build it in ChartDB with the AI Agent
Then ask yourself one question:
Which one made you feel more in control of your database, not less?
If you want to try ChartDB, you can start free, connect your own database, and see your schema as a living diagram in a few minutes.
👉 Try ChartDB for free and see if it earns a permanent tab in your browser.
Additional Resources
A while ago I was trying to explain a pretty simple question to a teammate:
“This customer_id here… where does it actually come from?”
Five minutes later I had three tabs open, a migration folder, an old Confluence page, and zero clarity. At that point it does not matter how clean your SQL is. If you cannot see the schema, you are guessing.
That is where tools like Dbdiagram, DrawSQL, and ChartDB come in. They all promise the same thing on paper: “visualize your database.”
But they feel very different when you sit down, open a browser, and try to model a real system.
I am Jonathan, founder of ChartDB. I have been living in ERDs and database tooling for years, both as an engineer and now as a founder. For this comparison, I did something simple and honest:
I created the same small SaaS schema in all three tools:
users
teams
projects
subscriptions
Then I paid attention to what felt smooth, what got in the way, and where each tool shines. You can absolutely recreate the same test yourself, and if you want to publish this on the ChartDB blog you can drop in screenshots from all three tools.
This is not meant to trash anyone. Dbdiagram and DrawSQL are good products. The point is to help you pick the right tool for your team.
How I’m Comparing Them (Without Overthinking It)
I did not want a 40 row spreadsheet that nobody reads. So I stuck to the things that actually matter when you are working with real databases:
Can it import or sync from an existing database?
Which databases and formats does it speak well?
How does collaboration feel in practice?
Can I share or embed diagrams easily?
What does export look like when I need SQL or an image?
Any real AI capabilities or just buzzwords?
Does it die when you throw a big schema at it?
Are there templates or examples so I do not start from a blank canvas?
Any integrations that actually save time?
What are the hosting and security options?
How painful or friendly is the pricing?
And finally, do the people behind it seem to care?
Keep these in the back of your head while you read through each tool. You will probably feel which one fits your style.
Dbdiagram
What Dbdiagram Is Trying To Be (dbdiagram)
Dbdiagram.io is for developers who like text more than drag and drop. Instead of placing tables on a canvas, you describe your schema using DBML or SQL, and Dbdiagram turns that into a visual ERD.
It feels a bit like writing code and getting a diagram as a side effect. Which is pretty nice if that is how your brain works.
For this test, I wrote the SaaS schema in DBML and watched the diagram appear almost instantly. Clean, minimal, and familiar.
How It Handles The Important Stuff (dbdiagram)
Import and sync
You can paste SQL or DBML and get a diagram. There is no “live connection” to a running database that keeps things in sync, so Dbdiagram is better for design and documentation than continuous introspection.
Supported databases
It covers the usual suspects: Postgres, MySQL, SQL Server, and friends. If you are living in classic relational land, you are fine.
Collaboration and sharing
You can share diagrams with links and invite collaborators. It works, especially for smaller teams. It is not trying to be a full blown collaborative workspace.
Sharing and embeds
Most people export an image and paste it into Notion, Confluence, or a pull request. It is pretty stock, but it gets the job done.
Export options
You get SQL exports in different dialects, plus images. That is usually enough for reviews and migrations.
AI capabilities
Right now, Dbdiagram is not really an AI first tool. You do the thinking, you write the structure, it draws what you tell it to.
Performance with larger schemas
It feels good on small and medium diagrams. Once you hit a bigger schema with lots of tables, things can get visually dense. You need to be disciplined with layout.
Templates and examples
There are some examples and community snippets. Helpful if you need a starting point or want to see how others structure their DBML.
Integrations, hosting, security
It runs as a hosted SaaS. No self hosted open source version. If you have strict data residency needs, keep that in mind.
Pricing in Real Terms (dbdiagram)
There is a free tier that is genuinely useful for individuals and small projects. Once you want more private diagrams, more projects, and team usage, you move into paid plans.
That is usually how teams use it:
Start free
Hit the limits
Upgrade once it becomes annoying
Nothing shocking here.
Who Dbdiagram is great for:
Developers who prefer writing schemas in text, like DBML or SQL, and want a quick visual representation without a lot of ceremony.
DrawSQL
What DrawSQL Is Going For (DrawSQL)
DrawSQL feels like Dbdiagram’s more visual cousin. It is very much “ERDs as a product,” with a modern interface, nice colors, and a focus on collaboration.
Instead of writing everything as code, you drag tables around, define relationships in a panel, and polish the diagram until it looks like something you could show to a non engineer.
For this comparison, I recreated the same SaaS schema visually in DrawSQL. It looked good. The canvas feels modern and friendly.
How It Handles The Important Stuff (DrawSQL)
Import and sync
DrawSQL lets you import SQL, which is handy when you do not want to start from scratch. It is still not a live sync engine, so if your database changes, you need to re import or adjust things manually.
Supported databases
Supports popular relational databases. If your team primarily uses Postgres, MySQL, or SQL Server, you are covered.
Collaboration
This is where DrawSQL leans hard. Multiple people can work on the same diagram, and it really feels like a shared design space. Great for schema reviews and planning sessions.
Sharing and embeds
You can share links, and there are options to embed diagrams where you need them. If your team likes to see diagrams inside dashboards or documentation, this is a big plus.
Export options
DrawSQL exports SQL, PNG, PDF, and more. So if you need to slap an ERD into a spec or slide deck, it is easy.
AI capabilities
As of now, DrawSQL does not really feel like an AI powered tool. It is more like a very nice manual editor with collaboration on top.
Performance with larger schemas
It can handle reasonably large schemas, but like any fully visual editor, big diagrams require careful organization. If you throw 150 tables at it in one view, things will get tight.
Templates and examples
The template library is honestly one of the nicest things about DrawSQL. You can browse existing schemas, clone them, and adjust. Very useful for “I know this pattern exists, just show me something close.”
Integrations, hosting, security
Hosted SaaS only. No open source self hosted build. So again, fine for many teams, less ideal if you are strict about where your database structure lives.
Pricing in Real Terms (DrawSQL)
You get a free or hobby tier with limits on tables and diagrams. Then a couple of tiers that add more diagrams, more tables, and more users.
Roughly:
Individuals and hobby projects: stick to free or the lowest paid tier
Small to mid teams: end up on the mid tier
Larger teams: go to the team or business tier to remove friction
If you like the product, paying for it usually feels reasonable because you are using it heavily in your workflow.
Who DrawSQL is great for:
Teams who want pretty, collaborative ERDs that feel good to work in, and who do not mind doing most of the modeling work by hand.
ChartDB
What We’re Building With ChartDB
ChartDB is the one I am biased about, obviously. I built it because I was frustrated with the gap between:
“I have a real database with 80 tables and weird history”
and“I want a clean ERD that I can actually reason about.”
ChartDB is a modern ERD and database visualization tool that is designed to be:
friendly for developers
powerful enough for big schemas
and actually helped by AI, not just marketing copy
The core idea is simple. You connect your database or paste SQL, and ChartDB gives you a live, navigable diagram. Then you can let the AI Agent help with the boring parts.
For this comparison, I took the same SaaS idea, gave the AI Agent a short prompt, and got an initial schema. From there I moved some tables, added colors for domains, and tightened the relationships. It felt like pairing with a smart assistant, not starting from a blank canvas.
How It Handles The Important Stuff (ChartDB)
Import and sync
You can:
connect to real databases (Postgres, MySQL, SQL Server, SQLite, MariaDB, more over time)
import SQL dumps
or even generate a schema from scratch with AI
ChartDB is built to understand real schemas that already exist, not just toy examples.
Supported databases
Focused on relational databases, but across multiple engines. If you live in SQL land, it is a good fit.
Collaboration
You can invite teammates, share read-only links, and use ChartDB for planning sessions or reviews. It is definitely built with teams in mind, not just solo architects.
Sharing and embeds
You can share diagrams with stakeholders, embed them where you need them, and use them as a living map of your system rather than a one off export.
Export options
ChartDB gives you:
SQL and DDL exports in multiple dialects
image exports for docs and decks
Plenty to plug into migrations or internal documentation.
AI capabilities
This is the big one.
With the AI Agent you can:
Generate an ERD from a simple text description (for example, “multi tenant SaaS with users, orgs, projects, subscriptions, and audit logs”)
Ask it to add timestamps or soft deletes across all tables
Let it suggest foreign keys you missed
Clean up naming and group tables by domain
It does not replace thinking, but it cuts down a lot of repetitive work and gives you a second brain when you are cleaning up existing databases.
Performance with large schemas
ChartDB is wired to handle big schemas. Domain based colors, areas, zooming, filtering. You can actually work with large diagrams without wanting to close the tab.
Templates and examples
You can use templates, or just rely on the AI to create a solid first draft. Personally, I often type what I would write in a spec and let it turn that into tables and relationships.
Integrations, hosting, security
There is a hosted cloud version if you want the easy path. There is also an open source, self hosted option for teams that need more control or want it inside their own network.
That open source piece matters for a lot of engineering teams. You do not always want your entire schema living in someone else's SaaS.
Pricing in Real Terms (ChartDB)
There is a free plan that is genuinely useful. You can try it with your real database, not just a toy example.
Paid tiers unlock:
more diagrams
more AI usage
team collaboration features
Most teams I talk to start free, then upgrade once ChartDB becomes part of their weekly workflow.
Who ChartDB is great for:
Engineering and data teams that want an ERD tool that can handle real life schemas, make use of AI for the repetitive parts, and still feel fast and modern.
Quick Comparison Table
Here is a simple view you can drop into the blog so people can skim.
Feature | Dbdiagram | DrawSQL | ChartDB |
Main style | Text first | Visual first | Visual plus AI |
Input | DBML, SQL | Visual editor, SQL import | SQL, live DB, natural language |
Live DB friendly | Not really | Not really | Yes, built for it |
AI for ERDs | No | Very limited or none | Yes, core part of the product |
Collaboration | Basic sharing | Strong real time collaboration | Team friendly, built for reviews |
Templates | Some examples | Rich template library | Templates plus AI generated starters |
Export | SQL, images | SQL, images, PDF | SQL, DDL, images |
Self hosted option | No | No | Yes, open source core |
Best fit | Devs who like code based ERDs | Teams who want pretty, visual ERDs | Teams who want AI, scale, and modern UX |
You can tweak this table with whatever details you care about most.
So… Which One Should You Actually Use?
If you are still reading, you probably want a straight answer.
Here is how I would think about it if I were in your shoes.
If you love writing schemas in text, and just want a clean diagram from DBML or SQL, Dbdiagram is a nice, simple option. Low friction, easy to learn, and very developer centric.
If you want polished, shareable diagrams and your team loves working visually together, DrawSQL gives you a very pleasant experience. Especially good for architecture reviews, spec documents, and anything that needs to look nice.
If your reality is bigger schemas, multiple databases, legacy structure that needs cleaning, and you like the idea of pairing with an AI assistant while you design and document, ChartDB is probably the best long term fit.
Dbdiagram and DrawSQL both do what they claim, and I would genuinely recommend them in the right context.
The reason I am betting my time and energy on ChartDB is that the job has changed. We are not only drawing ERDs for slides anymore. We are keeping real systems understandable while they grow like crazy, and we finally have AI that can help with that.
If you are curious how that feels in practice, do the same test I did:
Take one schema or idea
Build it in Dbdiagram
Build it in DrawSQL
Build it in ChartDB with the AI Agent
Then ask yourself one question:
Which one made you feel more in control of your database, not less?
If you want to try ChartDB, you can start free, connect your own database, and see your schema as a living diagram in a few minutes.
👉 Try ChartDB for free and see if it earns a permanent tab in your browser.
Additional Resources

Continue Reading


© 2025 ChartDB
© 2025 ChartDB
© 2025 ChartDB